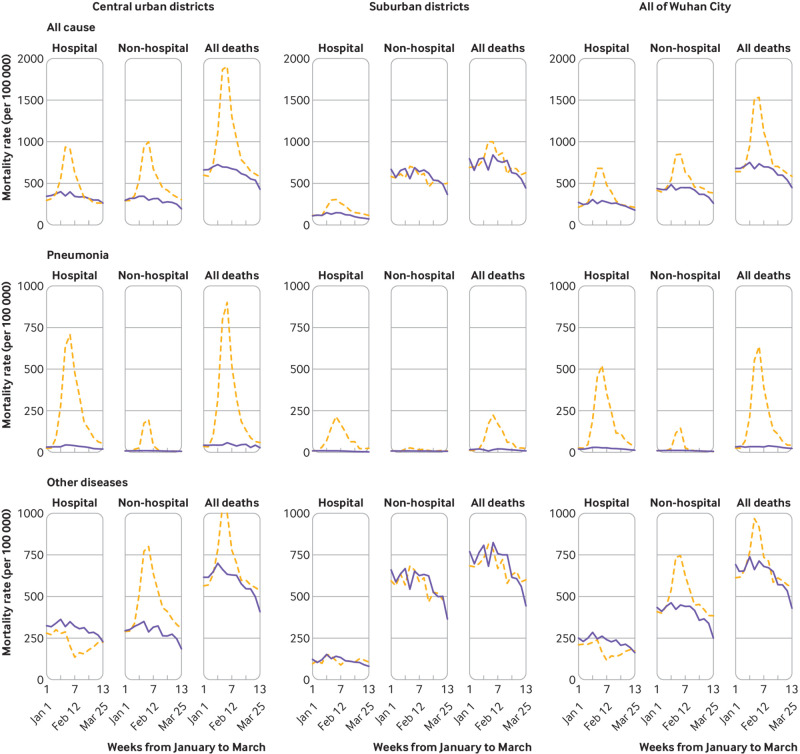
Fig 3.
Trends in weekly hospital and non-hospital mortality rates from all causes, pneumonia, and other diseases during 1 January and 31 March 2020 compared with 2019 across different districts of Wuhan city, China. Dashed orange lines indicate observed mortality rates in 2020 and blue solid lines indicate observed mortality rates in 2019

