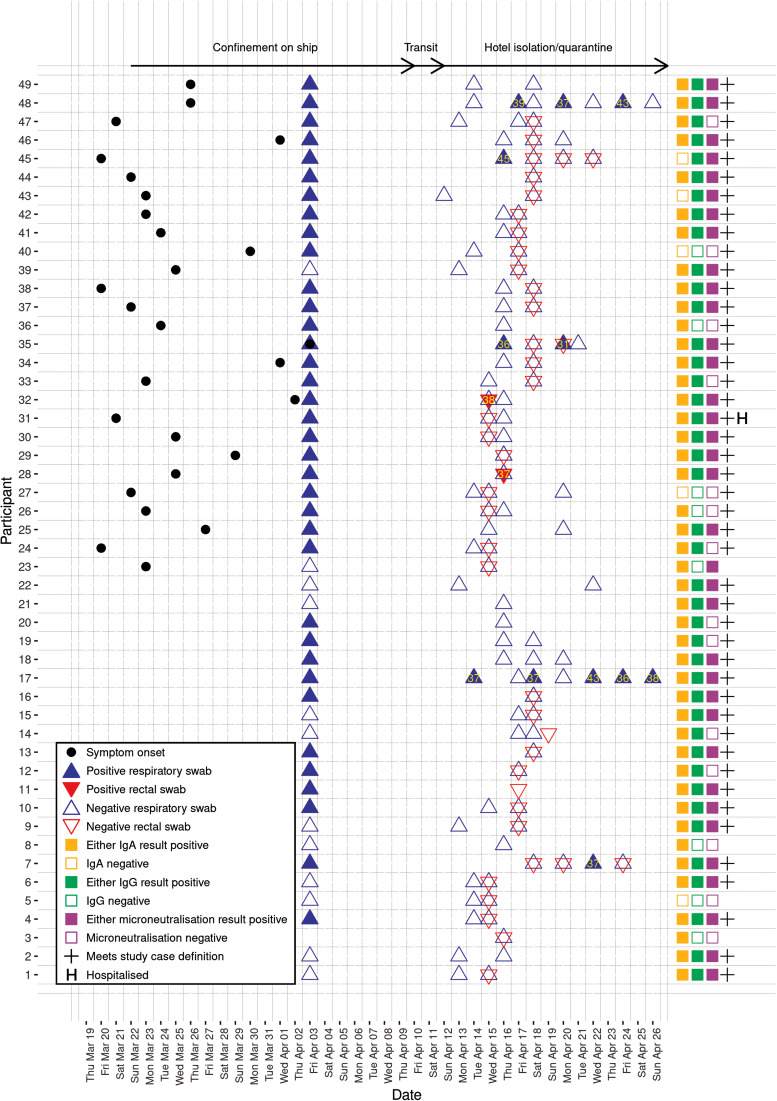
Fig. 2.
Timing of symptom onset, SARS-CoV-2 PCR testing and anti-SARS-CoV-2 serology, for 49 study participants. Participants were members of a cohort exposed to SARS-CoV-2 on board a cruise ship. Yellow numerals show cycle threshold (Ct) values. Serology results, case status and hospitalisation are presented on the right-hand side of the plot for readability, blood samples were collected on 16–17 April 2020 and 24 April 2020. Ig, immunoglobulin.

