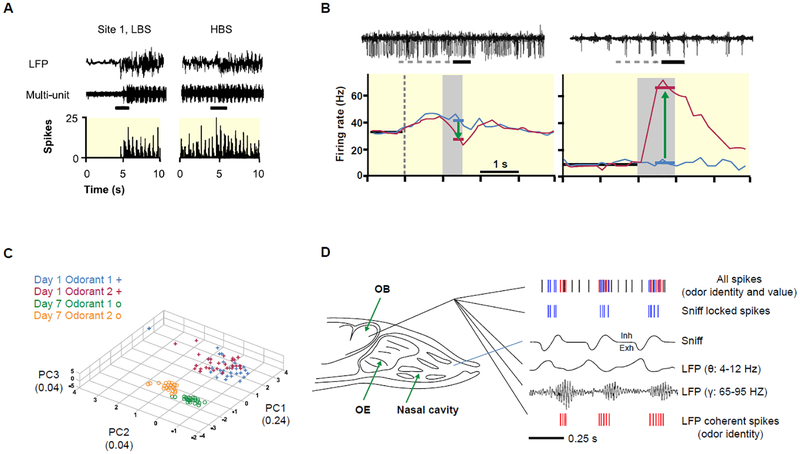
Fig 2.
Odor response of M/Ts under different anesthesia levels (brain states). A. Odor response of M/Ts under low brain state (LBS) and high brain state (HBS). Raw LFP signals (top), raw multiple-unit (middle) and histogram of spiking (bottom) at one recording site with 2s odor stimulation under LBS and HBS. The black bars represent odor stimulation. Modified from95 with permission. B. Odor response of M/Ts under awake (left) and anesthetized mouse (right). Top, raw traces of spiking recording from the same location in awake behaving and anesthetized mouse. The solid horizontal bars indicate time of odorant exposure (citral). The dashed bars indicate the time of final valve activation that in the behavioral paradigm corresponds to the time the mouse spend in the port before odor delivery. Modified from97, copyright 2006 Society for Neuroscience. C. Mitral cell population responses pooled across all animals in the difficult discrimination task, plotted for day 1 (animals can’t discriminate odors) and day 7 (animals learned to discriminate odors) in the first three principal component axes. Note the increase in separation of odorant 1 and odorant 2 trials with training. Modified from101 with permission. D. The diagram shows a model that the firing of action potentials in the M/Ts carries information for odor reward, and the odor feature that carries information to differentiate between odors regardless of associated outcome, which could be odor identity or intensity, is carried by coherence between spike firing and gamma LFP. OE, olfactory epithelium. Inh, inhalation. Exh, exhalation. Modified from12 with permission.

