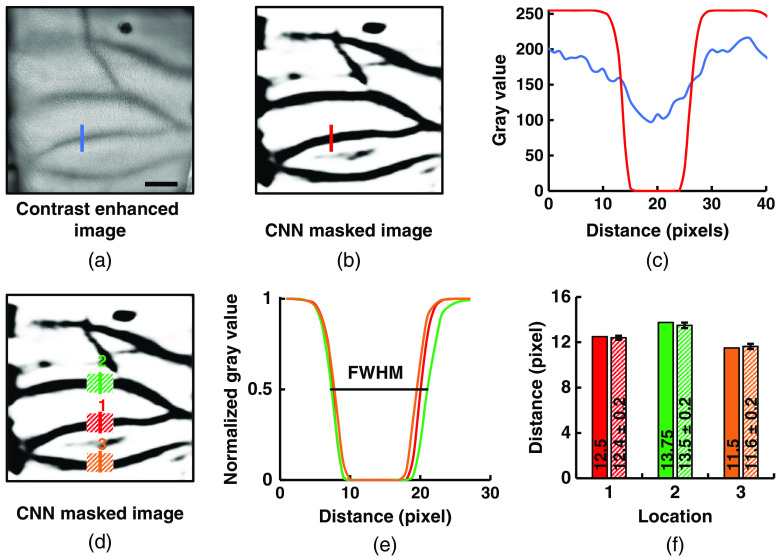
Fig. 3.
Quantitative measurement of VD. (a) Vein existing ROI is cropped from the raw image for processing. Scale bar = 10 mm. (b) Raw image was further processed for VD measurement. (c) A quantitative measurement of an arbitrary vein is scanned in 1D position to emphasize the reason for raw image processing. The blue and red lines in the plot represent gray values of the raw and processed images, respectively. Red color line shows a significant difference from the blue line, which are used to clearly determine VD. (d) However, 1D scan gray value measurement could be confusing as the vein is not symmetric in size for its whole length. A random area from the target vein is selected to measure its average. (e) The dark red, green, and orange lines in the plot are the 1D scan gray values, respectively, for 1, 2, and 3, as shown in (d). The VD is measured by determining FWHM of the Gaussian curve. (f) A quantitative analysis is shown in the dark and shaded bar plot for VD measurement in single line scan and area scan, respectively.

