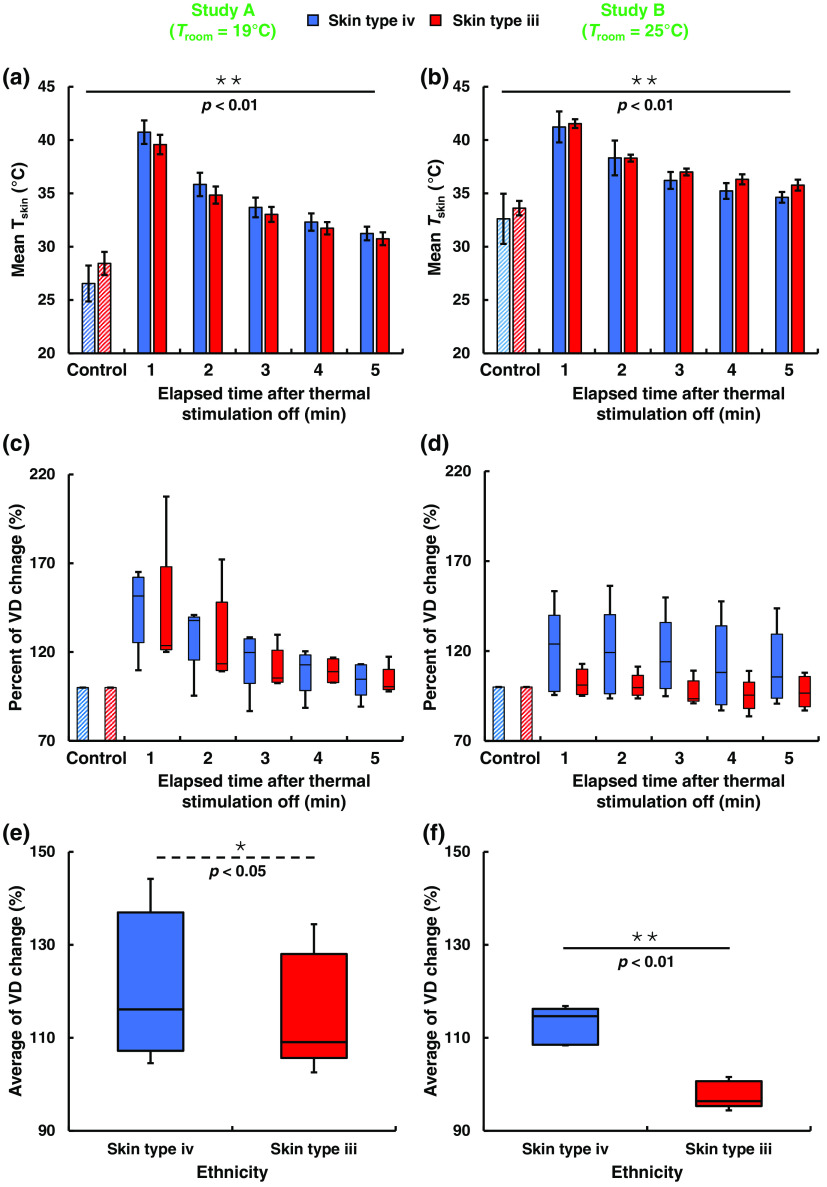
Fig. 5.
Before and after thermal stimulation effect on and VD. (a) and (b) Values are shown as the average of the participants’ at studies A and B (). After the radiation heat exposure, there was a significant difference observed for as shown in the bar chart. (c) and (d) Vein dynamics observed from its percent of dilation for different skin types. The vein was dilated after heat exposure to the dorsal hand surface. The standard deviation of VD was big as each individual has a different percentage of the dilation from their base diameter. However, the individual change of each person has a significant difference from their base value. (e) and (f) Time average of VD change shows a significant difference between two different races as confirmed by Student’s -test. * and ** indicate the significant difference of -value at and , respectively.

