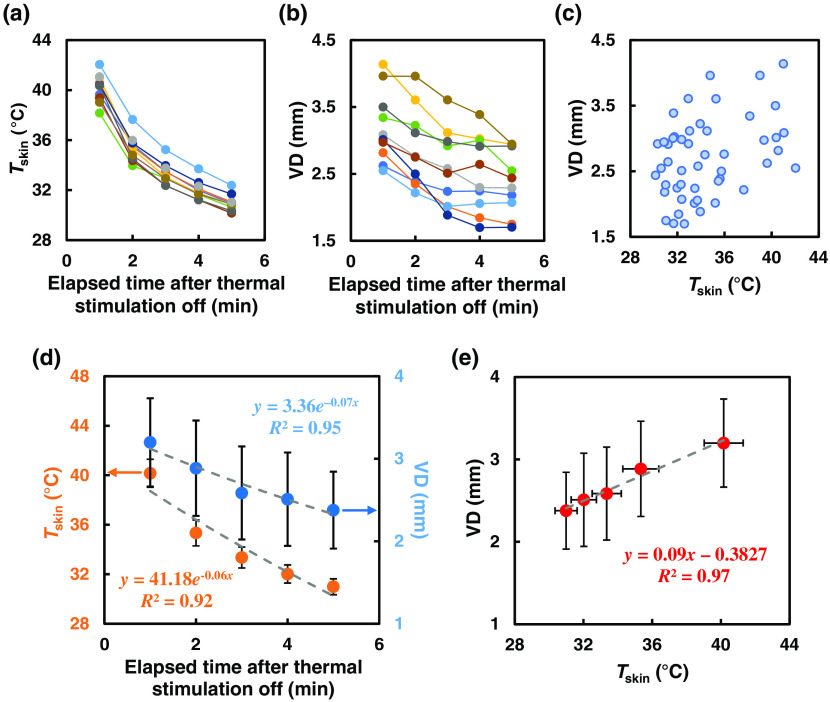
Fig. 6.
(a) and (b) Individual data points of and VD for 5 min after thermal stimulation off. (c) A scatter plot that shows the VD change with change of regardless of the vein size and race. (d) Mean and VD exponentially decrease with time after removing the thermal stimulation in study A condition (). (e) Linear correlation between the and VD is shown, and the value indicates a good agreement between them.

