Figure 2.
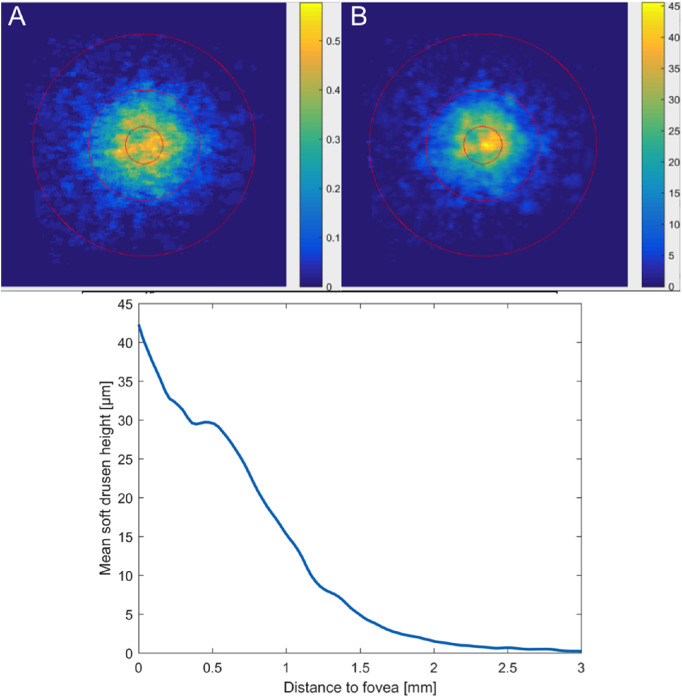
Soft drusen metrics. (A) Spatial distribution of soft drusen across the ETDRS subfields at the baseline visit of eyes with early to intermediate AMD. Each pixel demonstrates the color-coded percentage coverage by soft drusen in that particular location across the baseline visit of analyzed eyes. Soft drusen had a peak accumulation within the central ETDRS subfield with decreasing percentage areas with increasing distance from the foveal center. (B) Mean height of soft drusen across the three ETDRS subfields at the baseline visit of eyes with early to intermediate AMD. Each pixel shows the color-coded mean height in µm of soft drusen present in that specific location. Soft drusen located within the central ETDRS subfield showed the peak height compared to the inner and outer ring. (C) Relationship between height of soft drusen and distance from the foveal center. A quantitative topographic profile shows the mean drusen height (in µm) of all eyes at the baseline visit, as a function of eccentricity (in mm) computed along circles of increasing diameter starting from the fovea. Soft drusen height falls off sharply with increasing distance from the foveal center.

