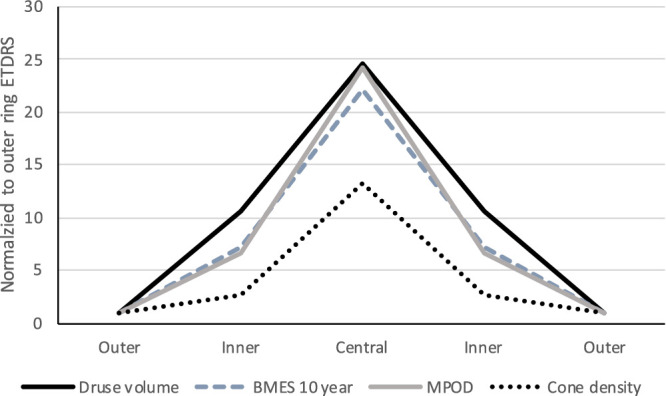
Figure 3.

Topography of drusen volume, progression risk, and candidate mechanisms. To compare the spatial topography for drusen volume measured in this study to published values for drusen-related progression risk, cone density, and MPOD, all four variables were expressed within ETDRS subfields (central, inner ring, and outer ring) and plotted on the same axis. MPOD for right and left eyes were averaged. Each variable was normalized by its value in the outer ETDRS ring. Values for inner and outer rings are plotted symmetrically on either side of the central subfield. Ratios of the central peak to the outer ring were 22, 25, and 24 for BMES 10-year, drusen volume, and MPOD, respectively, and 13 for cones. The similar topography of drusen volume, progression risk, and MPOD is apparent. Cone density has a lower peak relative to the outer ring and falls off less steeply than the other parameters. BMES, Blue Mountain Eye Study; MPOD, macular pigment optical density.
