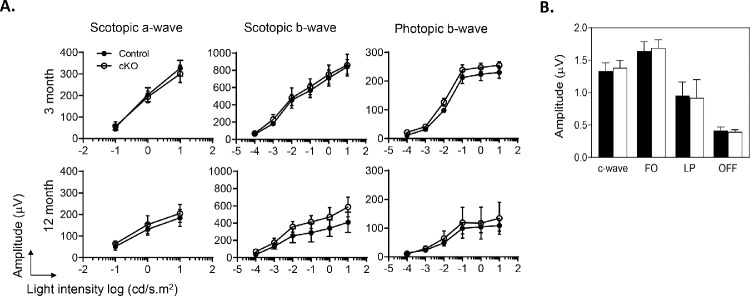
Figure 4.
RPE and retinal functionality in RPE-Pnpla2-cKO mice. (A) ERG amplitude graphs of scotopic a- and b-waves and photopic b-waves, as a function of light intensity (x-axis) of 3- and 12-month-old cKO mice (open circles) and littermate controls (Pnpla2f/f, closed circles) (n = 3 per genotype). (B) Bar graph showing the amplitude (mean, SD) of the c-wave, fast oscillation (FO), light peak (LP), and off-response (OFF) measured by DC-ERG of 11-week-old cKO mice (n = 4, open bars) and Pnpla2f/f and Pnpla2f/+ control mice (n = 5, closed bars).

