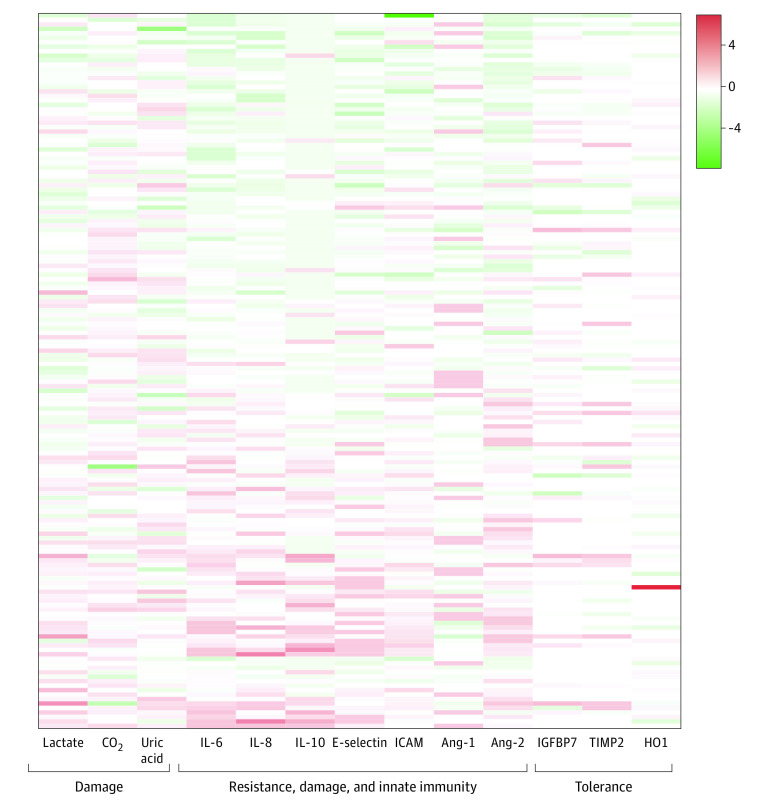
Figure 3. Biomarker Values.
Heatmap showing the log-fold change of the median biomarker value (x-axis) per patient for various markers of the host response grouped by those reflecting damage, resistance and innate immunity, and tolerance. Red represents 4 log fold greater median (4) biomarker value for that patient compared with the median of the entire study (0); green represents 4 log fold lower (−4) values of the biomarker compared with the median of the entire study. White cells are those in which the biomarker was not measured. Ang-1 indicates angiopoietin 1; Ang-2, angiopoietin 2; CO2, carbon dioxide; HO1, heme-oxygenase 1; IL, interleukin; IGFBP7, insulinlike growth factor binding protein 7; ICAM, intracellular adhesion molecule; and TIMP2, tissue inhibitor of metalloproteinases 2.

