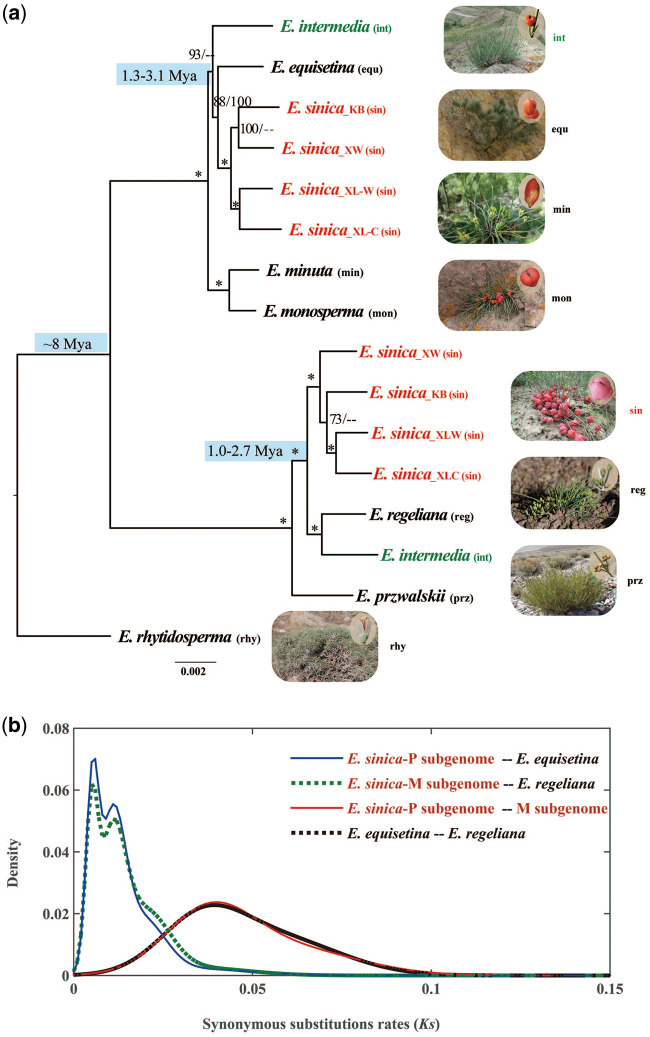
Fig. 2.
Phylogenetic analysis based on the concatenation method and divergence time estimation. (a) A maximum-likelihood tree showing the phylogenetic relationships among the two subgenomes of two polyploid species and their putative diploid parents. Numbers associated with nodes are bootstrap support (BS) values obtained from the concatenation (left) and coalescent (right) analysis, respectively. An asterisk indicates BS of 100%. Diploids are in black, and polyploids are in color. (b) Density distribution of Ks among the two subgenomes of Ephedra sinica and its putative diploid parents.

