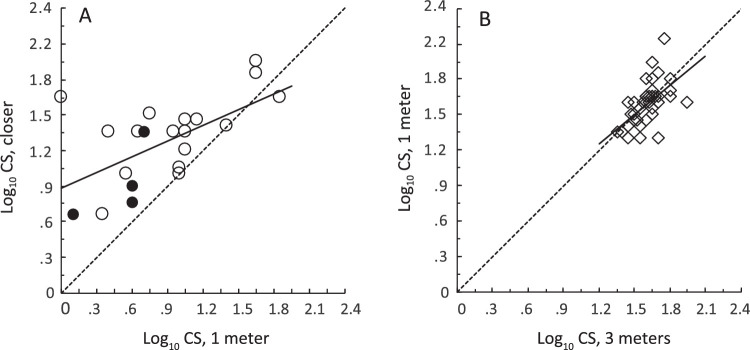
Figure 2.
The effect of test distance on Pelli-Robson contrast sensitivity. Dotted lines: equality. Continuous regression lines were fitted to the data. (A) Contrast sensitivity of students with low vision at the closer distance, as a function of their contrast sensitivity at 1 meter. Solid circles: students who were tested at more than d meters from the chart. (B) Elders’ contrast sensitivity at the closer distance (1 meter), as a function of their contrast sensitivity at the farther distance (3 meters).

