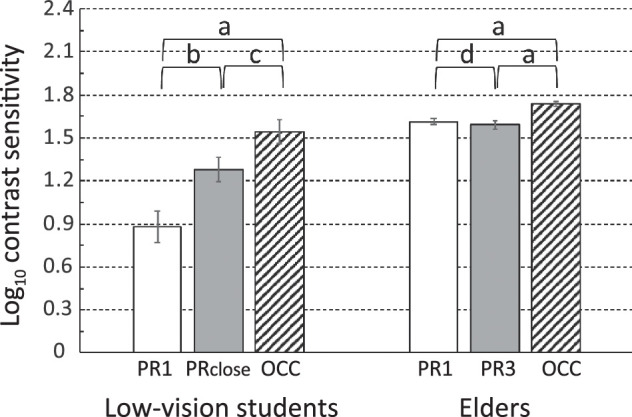
Figure 3.

Comparison between contrast sensitivity measured using the PR at 1 meter (white bars) and at another distance (gray bars) and using the OCC (hatched bars), ±1 standard error of the mean. “a”: P < 0.0003; “b”: P = 0.0006; “c”: P = 0.007, “d”: P > 0.5, n.s. Horizontal lines mark 0.3 log10 units, the contrast difference between two adjacent rows on the PR chart.
