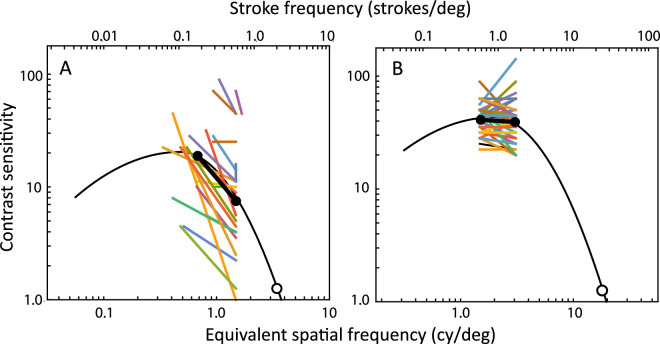
Figure 5.
Individual participants’ PR contrast sensitivity values (colored lines) compared to the CSF of the visual system (black curves), fitted as a template to the average PR contrast sensitivity (black circles and bars) and average letter visual acuity (white circles). Lower axis, the spatial frequency of the channel used to identify the letter. Upper axis, the spatial frequencies of the strokes comprising the letters, based on their logMAR values. See Majaj et al.11 for details of the conversion between the upper and lower abscissas. (A) Students with low vision; (B) elders.

