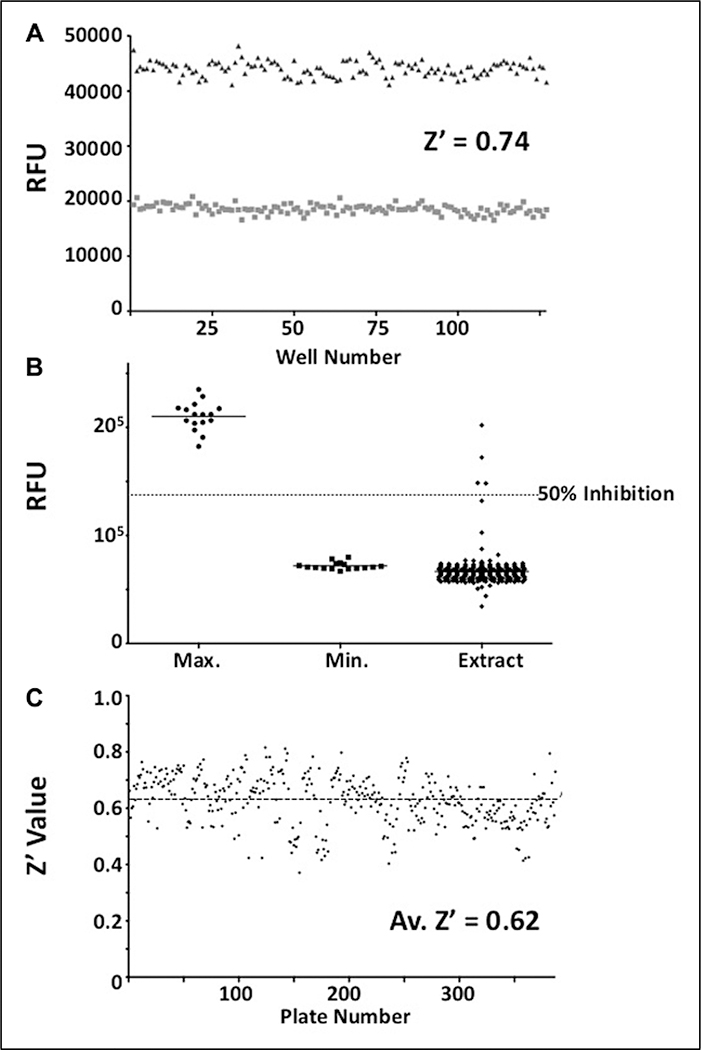
Figure 3.
Tyrosyl-DNA phosphodiesterase 1 (TDP1) screening assay performance. (A) The screening assay was initially examined for suitability in the detection of inhibitors of TDP1 catalytic activity. Representative data show residual fluorescence values for wells containing 500 nM substrate and 500 pM TDP1 in the absence (■) and presence (▲) of 10 mM vanadate inhibitor after incubation for 50 min. The Z′ value for these data is 0.74, with coefficient of variation (CV) values of 4.48% and 3.08% for uninhibited and inhibited wells, respectively. (B) In the presence of natural product extracts, the assay was well behaved, yielding a low number of extracts displaying significant inhibition (>50%) of TDP1 activity. The example data shown above are from a single 384-well plate containing 352 individual extract sample wells (◆), 16 fully inhibited control wells (●), and 16 uninhibited control wells (■). The Z′ value for this data set was 0.64, with CV values of 6.34% and 4.80% for uninhibited and inhibited wells, respectively. (C) Overall screening data quality was monitored via routine calculation of the Z′ value for each assay plate. The data displayed above shows Z′ values for all 387 natural product extract plates screened over the course of several months. The average Z′ value is 0.62, with the majority of the plates displaying Z′ values significantly above the lower limit of 0.4.

