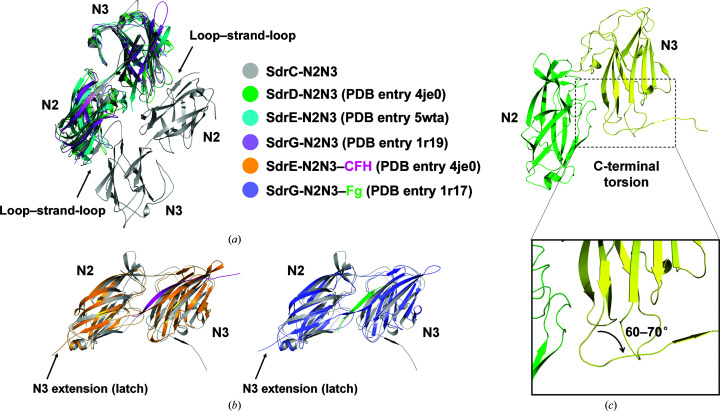
Figure 3.
Structural comparison of Sdr family proteins. (a) Superimposition of SdrC with other Sdr proteins (apo form). SdrD, SdrE and SdrG are colored as in Fig. 1 ▸. The SdrC dimer is shown in gray. Compared with other Sdr proteins, an extra loop–strand–loop (residues 487–495) is found in the C-terminus of SdrC-N2N3 (black arrow). (b) Superimposition of SdrC with the SdrE–CFH and SdrG–Fg complexes. SdrC is compared with SdrE (bright orange) and SdrG (slate) in their complexes with CFH (light magenta) and Fg (green), respectively. The latch structure in SdrE–CFH and SdrG–Fg formed by the C-terminal extension of N3 is indicated with a black arrow. (c) The deviation at the C-terminus in SdrC-N2N3. The local shift at the C-terminus of SdrC-N2N3 triggered a 60–70° deviation.

