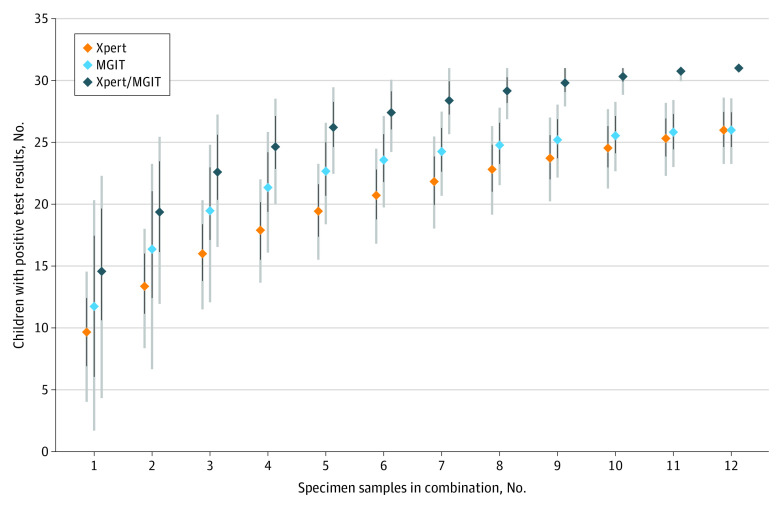
Figure 3. Average Cumulative Yield of Confirmed Cases by Number of Specimen Samples Among 31 Children With Confirmed Tuberculosis.
The average yield for 31 analyzable participants over all combinations of specimens is depicted in groups of 3 for all combinations of each number of specimens from 1 to 12: yield for Xpert MTB/RIF (Cepheid) alone, yield for mycobacteria growth indicator tube (MGIT) alone, and yield for both Xpert MTB/RIF and MGIT. The points depict average yield over the resampling distribution, black bars represent the interquartile range, and gray bars represent the interdecile range (10th to 90th centile).

