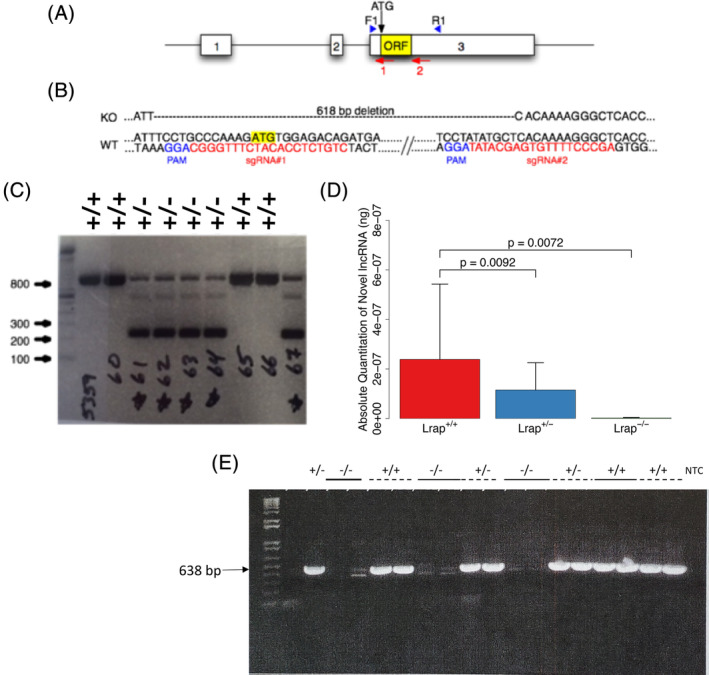
FIGURE 1.

Lrap−/− rat strategy and characterization. (A) Diagram of Lrap locus illustrating exons (numbered white boxes), the potential open reading frame (yellow ORF box), the putative start codon (ATG), sgRNA target sites (numbered red arrows) and the location of the forward and reverse PCR genotyping primers (blue arrowheads). (B) Partial Lrap wild type (Lrap+/+) and knockout (Lrap−/−) rat genomic DNA sequence. In red are the sgRNA target sequences used for CRISPR/Cas9 gene targeting. The CRISPR protospacer adjacent motifs (PAM) are shown in blue. The yellow highlighted ATG is the putative start codon. Note that the Lrap−/− sequence harbors a 618 bp deletion. (C) Lrap PCR genotype analysis. Ethidium bromide stained agarose gel of Lrap PCR products from Lrap wild type (Lrap+/+) and Lrap+/− rats. Ladder is in bp. (D) Validation of differences in Lrap RNA expression using qRT‐PCR. RNA expression levels of exons 1–3 in rat brains are reported as absolute quantity (n = 3/genotype). This PCR product is undetectable in the Lrap−/− rats, since the exon 3 primer (Exon 3 R1) targets the excised region of exon 3. 14 All statistical analyses were done on the log transformed data and results are reported based on the back transformation of mean values and mean values plus one standard error. All p values were calculated using a one‐way ANOVA with post hoc pairwise comparisons. (E) qRT‐PCR products from Lrap+/+, Lrap+/− and Lrap−/− rats. Ethidium bromide stained agarose gel of products from qRT‐PCR of naïve Lrap+/+, Lrap+/− and Lrap−/− rats, using primers for exons 1 and 3: Exon 1 F2‐Exon 3 R1. 14 With the exception of the first lane (+/−), all other samples are run as duplicates
