
FIGURE 5.
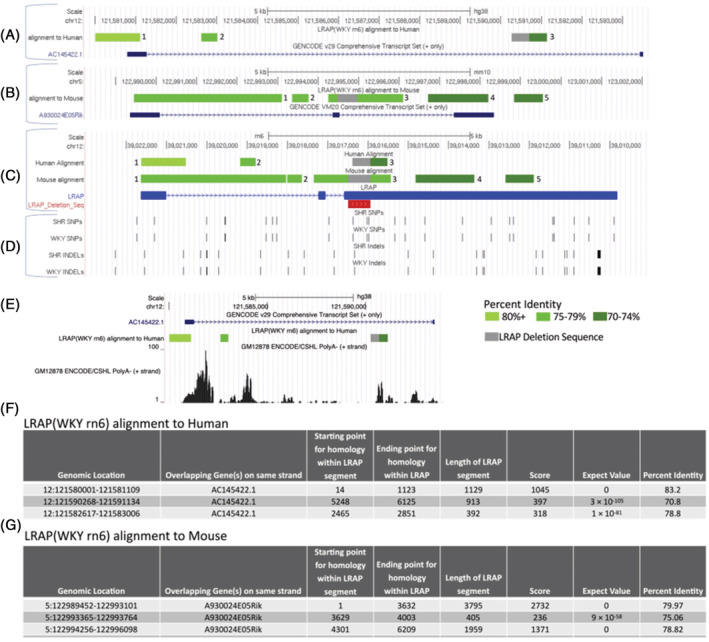
Regions of the mouse and human genome homologous to the region of the rat genome that contains Lrap. The entire genomic sequence of Lrap, that is, including introns, from the rat was compared with the mouse genome and the human genome. (A) Alignment of the Lrap genomic sequence to the human genome. The green blocks in the first track denote areas of homology in the human DNA sequence. The numeric label on each box corresponds to a row in (F). The intensity of the green color is related to the percent identity of the two sequences. The area highlighted in gray designates the homologous region of the human genome that was deleted in the rat. The second track 'GENCODE v29 Comprehensive Transcript Set (+ only)' contains an annotated human transcript, AC145422.1, produced from the same strand that is homologous to the Lrap sequence in this region. (B) Alignment of the Lrap genomic sequence to the mouse genome. The green blocks in the first track denote areas of homology in the mouse DNA sequence. The numeric label on each box corresponds to a row in (G). The intensity of the green color is related to the percent identity of the two sequences. The area highlighted in gray designates the homologous region of the mouse genome that was deleted in the rat. The second track 'GENCODE VM20 Comprehensive Transcript Set (+ only)' contains an annotated mouse transcript, A930024E05Rik, produced from the same strand that is homologous to the Lrap sequence in this region. (C) Human and mouse homologous sequences mapped onto the rat genome. The first track, 'Human Alignment', highlights the regions of the rat genome that are homologous to the human genome using the same coloring and labeling as in (A). The second track, 'Mouse Alignment', highlights the regions of the rat genome that are homologous to the mouse genome using the same coloring and labeling as in (B). The third track, 'Lrap', contains the original structure of Lrap derived from the transcriptome reconstruction in the SHR and BN‐Lx brain RNASeq data in blue and the region of Lrap that was eliminated in the knockout rats in red. Please note that the homologous regions have been superimposed and intervening regions are not to the same scale. In addition, since Lrap was transcribed from the negative strand in rat but is homologous to regions on the positive strand in both human and mouse, the orientation of (C) has been flipped so that the first exon of Lrap is on the left and the last exon of Lrap is on the right. (D) Genetic variants within the genomic area of Lrap. This panel provides information on polymorphisms (SNPs and indels) distinguishing the Wistar Kyoto rat strain and the related SHR rat strain from the BN rat strain (reference strain). This illustration also indicates the indels and SNPs that disrupt the possible ORF in the BN sequence. (E) RNA expression in human of Lrap locus. The genomic area depicted in this panel covers chr12:121,579,800–121,593,949 bp of the human genome (hg38). The first track 'GENCODE v29 Comprehensive Transcript Set (+ only)' contains an annotated human transcript, AC145422.1, produced from the plus strand. The second track 'LRAP (WKY rn6) alignment to Human' includes regions of human genome that are homologous to the region of the rat genome that produces the Lrap transcript. The intensity of the green color is related to the percent identity of the two sequences. The area highlighted in gray designates the homologous region of the human genome that was deleted in the rat. The third and final track 'GM12878 ENCODE/CSHL PolyA‐ (+ strand)' indicates the number of RNASeq reads that align to the region. RNASeq reads generated by the ENCODE/Cold Spring Harbor Lab were derived from long polyA‐ sequence of the GM12878 cell line and are publicly available through the UCSC Genome Browser and through the Gene Omnibus Database (GEO Accession: GSM758572). (F) Summary of Lrap alignment to the human genome contains additional detail, including percent homology, about the alignment of Lrap to the human genome. The numeric labels on the rows correspond to the green blocks in (A) with the same label. (G) Summary of Lrap alignment to the mouse genome contains additional detail, including percent homology, about the alignment of Lrap to the mouse genome. The numeric labels on the rows correspond to the green blocks in (B) with the same label