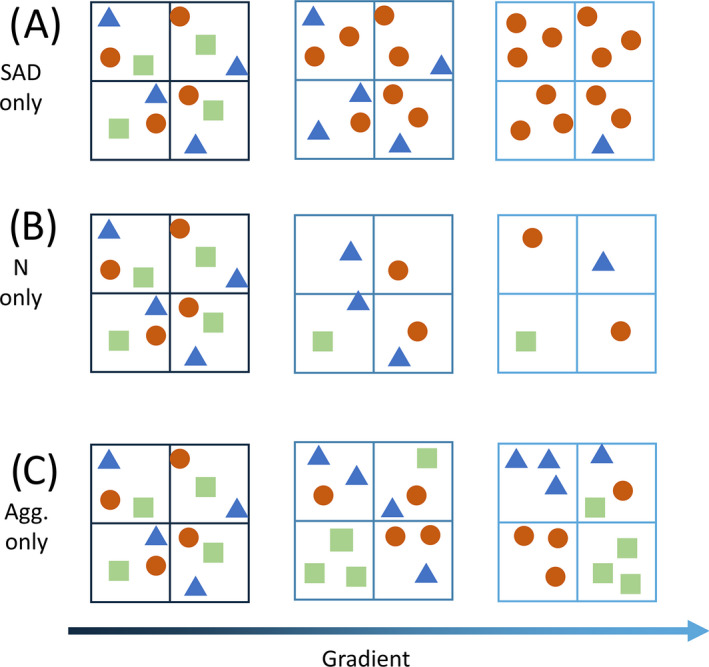
Fig 1.

Cartoon communities from three sites arranged along a gradient (color gradient from dark blue to light blue) in three simple scenarios in which only the (A) SAD, (B) N, or (C) aggregation shifts along the gradient. The large boxes represent sites, the small boxes represent plots, and the different symbols represent individuals of different species.
