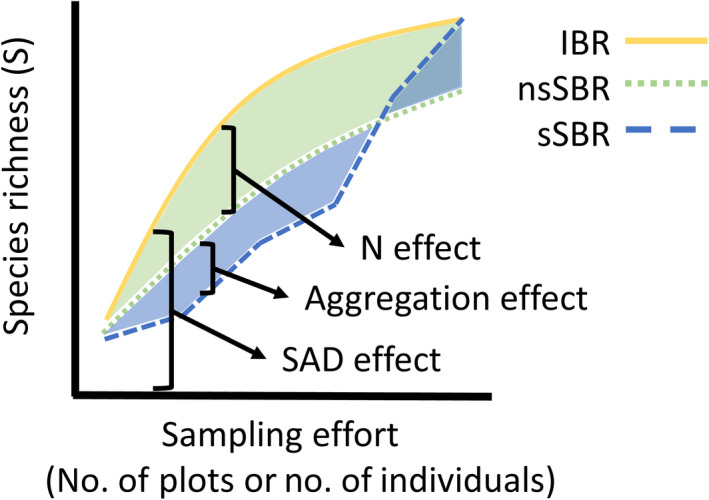
Fig 2.

The three rarefaction curves compared at one site along a gradient in which this particular site has lower individual density than an average site on the gradient (i.e., a negative N effect is illustrated here). The individual‐based rarefaction (IBR) is a direct expression of the SAD (yellow line). The nonspatial, sample‐based rarefaction (nsSBR) reflects both the SAD and variation in N; thus the difference between the nsSBR and the IBR provides an estimate of the N effect (light green area). The spatial, sample‐based rarefaction (sSBR) also takes spatial position into consideration; thus the effect of spatial aggregation is the difference between the sSBR and the nsSBR (light blue area). Note that the nsSBR must eventually intersect the IBR and sSBR at this site (i.e., all curves converge to the same total S once enough effort is considered).
