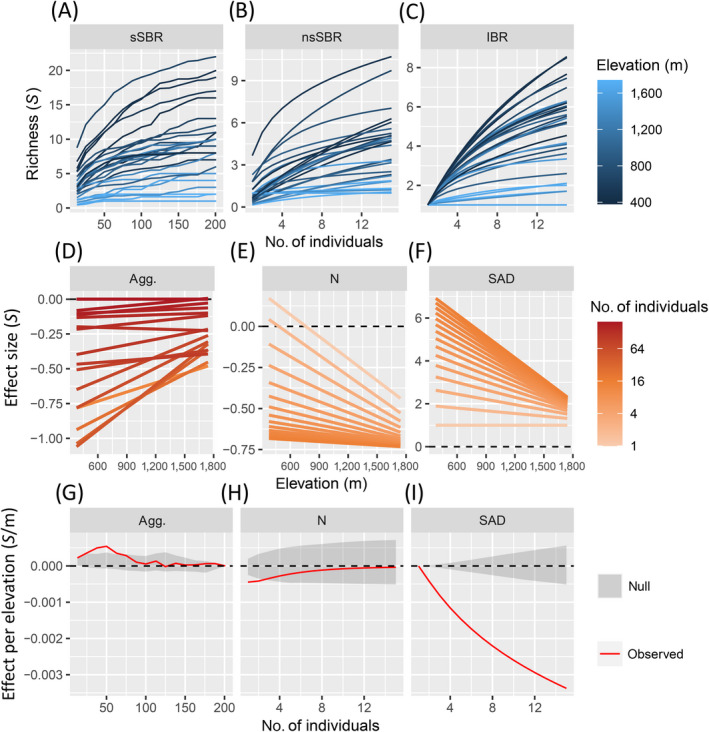
Fig 4.

Multiscale analysis for the ant communities. (A) The spatial, sample‐based rarefaction (sSBR), (B) the nonspatial, sample‐based rarefaction (nsSBR), and (C) the individual‐based rarefaction (IBR) all expressed against number of individuals where each curve was constructed from a different site along the elevational gradient (black to blue lines). Panels (D)–(F) show the regression lines of the linear model of ΔS ~ elevation (m) at each sampling scale (light orange to dark orange lines) because of (D) aggregation (Agg.), (E) density (N), and (F) species abundance distribution (SAD) effects. Note that the sampling effort color gradient is log transformed. Panels (G)–(I) show how the linear regression slope for each component of community structure changes across sampling efforts (range varies across panels) relative to null model expectations (gray polygon is the 95% quantile of the null model).
