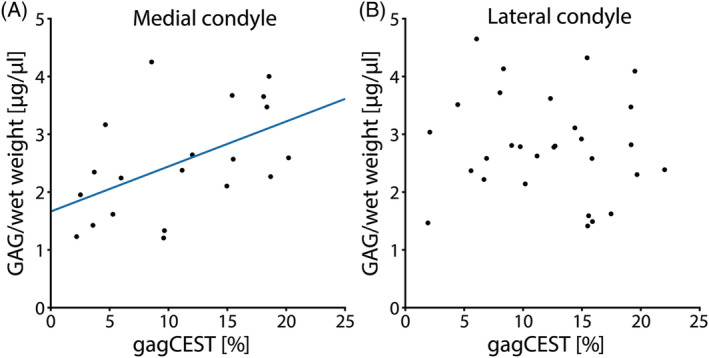
FIGURE 6.

Correlation graphs of GAG concentration as measured by DMMB and gagCEST MRI. A, all the data points of the medial condyle are plotted, including the trendline (r = 0.51, P = .05). B, all the data points of the lateral condyle are plotted, which show no clear trend (P = .47)
