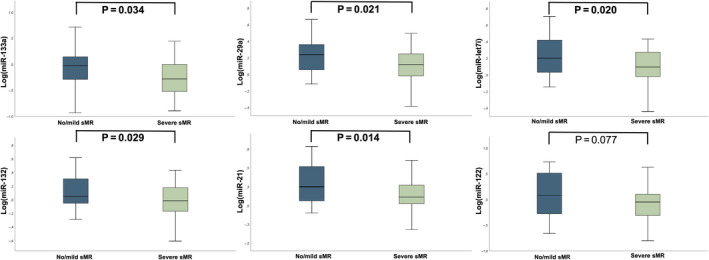
Figure 1.

miRNA profiles in HFrEF patients with either severe sMR or no/mild sMR (matched controls). MicroRNA profiles are displayed as Tukey boxplots, comparisons between patients with severe sMR and matched controls were analysed by an independent t test
