Figure 3.

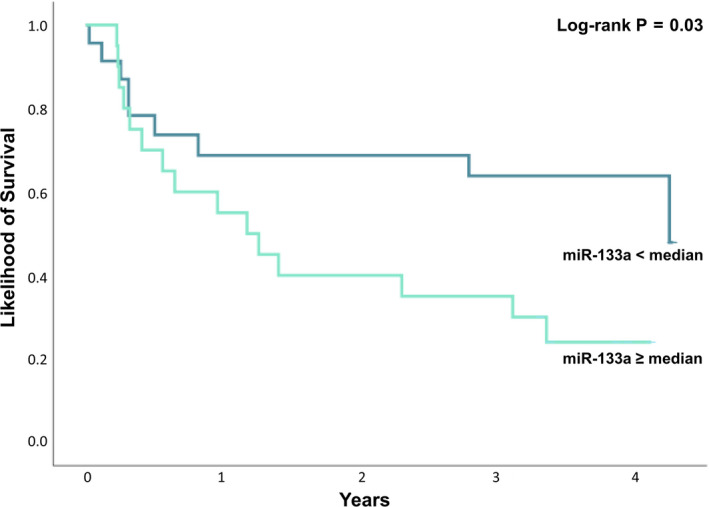
Kaplan‐Meier estimates of the primary outcome comparing patients with severe sMR and miR‐133a levels below the median to patients with severe sMR and miR‐133a levels above the median (log‐rank P = .03)

Kaplan‐Meier estimates of the primary outcome comparing patients with severe sMR and miR‐133a levels below the median to patients with severe sMR and miR‐133a levels above the median (log‐rank P = .03)