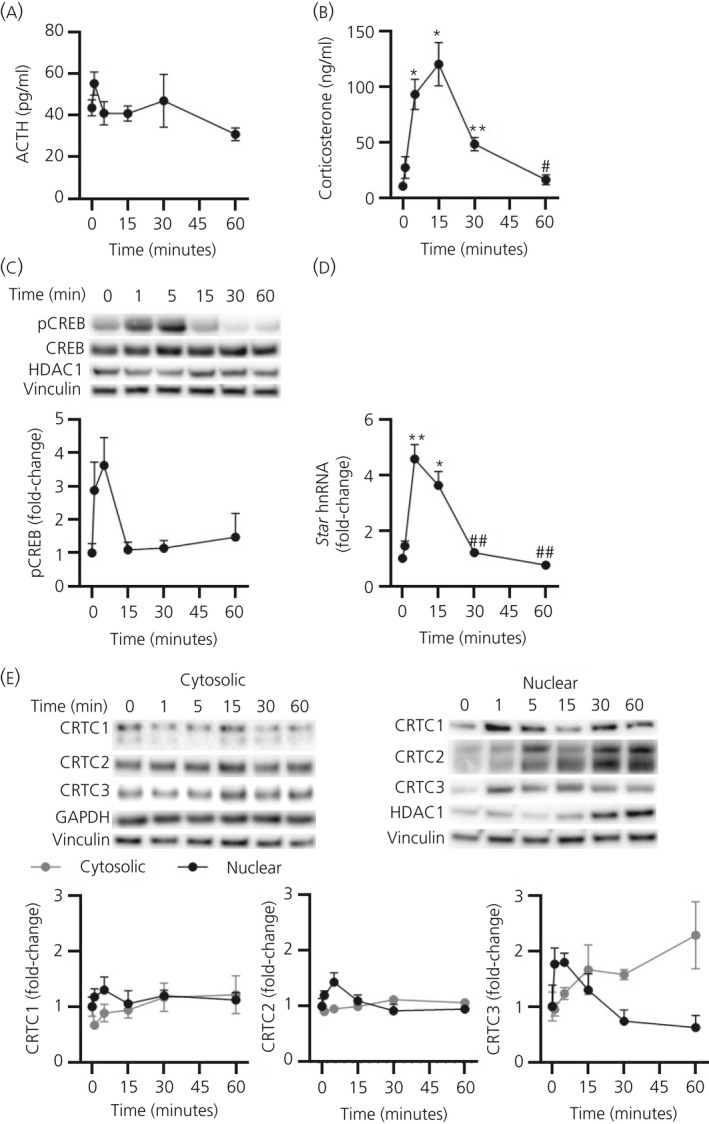
Figure 1.

Effect of an ultradian pulse of adrenocorticotrophic hormone (ACTH) on cAMP‐response element binding protein (CREB)‐regulated transcription coactivator (CRTC)1‐3 activation. (A) Plasma ACTH (pg mL‐1), (B) plasma corticosterone (ng mL‐1), (C) a representative immunoblot of nuclear levels of phosphorylated CREB (pCREB) and total CREB and semi‐quantification of nuclear pCREB, normalised to histone deacetylase 1 (HDAC1) (P = 0.851 by one‐way analysis of variance [ANOVA]) and vinculin (P = 0.999 by one‐way ANOVA), (D) Star heteronuclear RNA (hnRNA), normalised to glyceraldehyde 3‐phosphate dehydrogenase (Gapdh) mRNA (P = 0.177 by one‐way ANOVA) and (E) a representative western immunoblot of cytosolic and nuclear CRTC1, CRTC2 and CRTC3 protein levels and semi‐quantification of CRTC1, CRTC2 and CRTC3 from cytosolic protein, normalised to GAPDH (P = 0.998 by one‐way ANOVA) and vinculin (P = 0.292 by one‐way ANOVA) and nuclear protein, normalised to HDAC1 and vinculin (as above), following 10 ng of i.v. ACTH administration. Data are represented as the mean ± SEM (n = 5‐7 independent rats per group); data in (C) to (E) are expressed as fold induction of time 0. ACTH, corticosterone, pCREB, Star hnRNA and cytosolic CRTC1 and CRTC3 data were analysed using Welch’s ANOVA followed by Games‐Howell post‐hoc test; CRTC2 and nuclear CRTC1 and CRTC3 data were analysed using one‐way ANOVA followed by Tukey’s post‐hoc test. *P ≤ 0.05, **P ≤ 0.01 vs 0 min. #P ≤ 0.05, ##P ≤ 0.01 vs maximum levels
