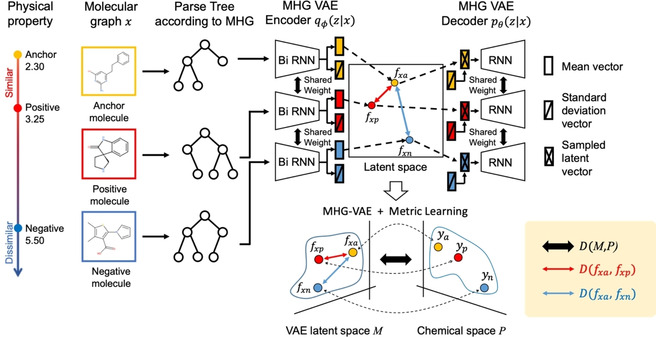
Figure 2.

Model schematic. To calculate metric loss, we label molecules with anchor, positive, and negative in molecules data set. In this figure, a, p, and n represent anchor, positive, and negative samples, respectively. is a latent vector corresponding to the input molecular graph . The VAE architecture uses the same model as Kajino's MHG‐VAE composed of encoder using Bi‐directional RNN and decoder using RNN. By optimizing the positions of the anchor, positive, and negative latent vectors, VAE latent space M becomes closer to the Chemical space P. represents the distance between and .
