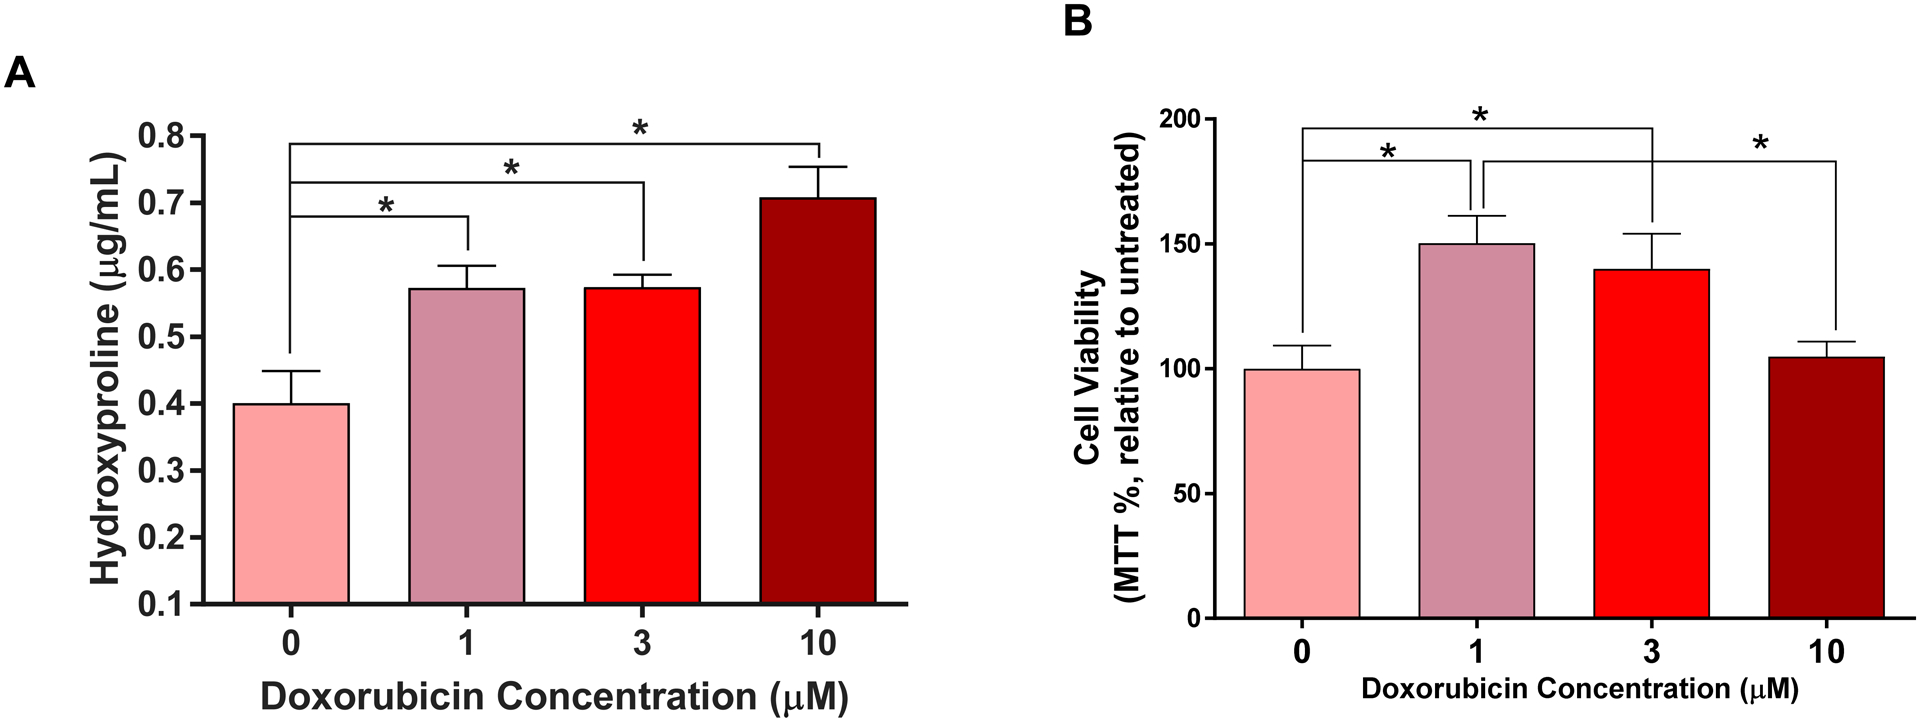
Figure 5. Isolated Cardiac Fibroblasts Exposed to Dox in-vitro.

(A) Dose-response curve of hydroxyproline secreted from isolated cardiac fibroblasts exposed to increasing concentrations of Dox (0, 1, 3 and 10 μM). * p<0.0001 vs. 0 μM. (B) Cardiac fibroblasts viability determined by the MTT assay after exposure to increasing concentrations of Dox (0, 1, 3 and 10 μM). All values are mean ± SEM. * p<0.003 vs. 0 μM n=4.
