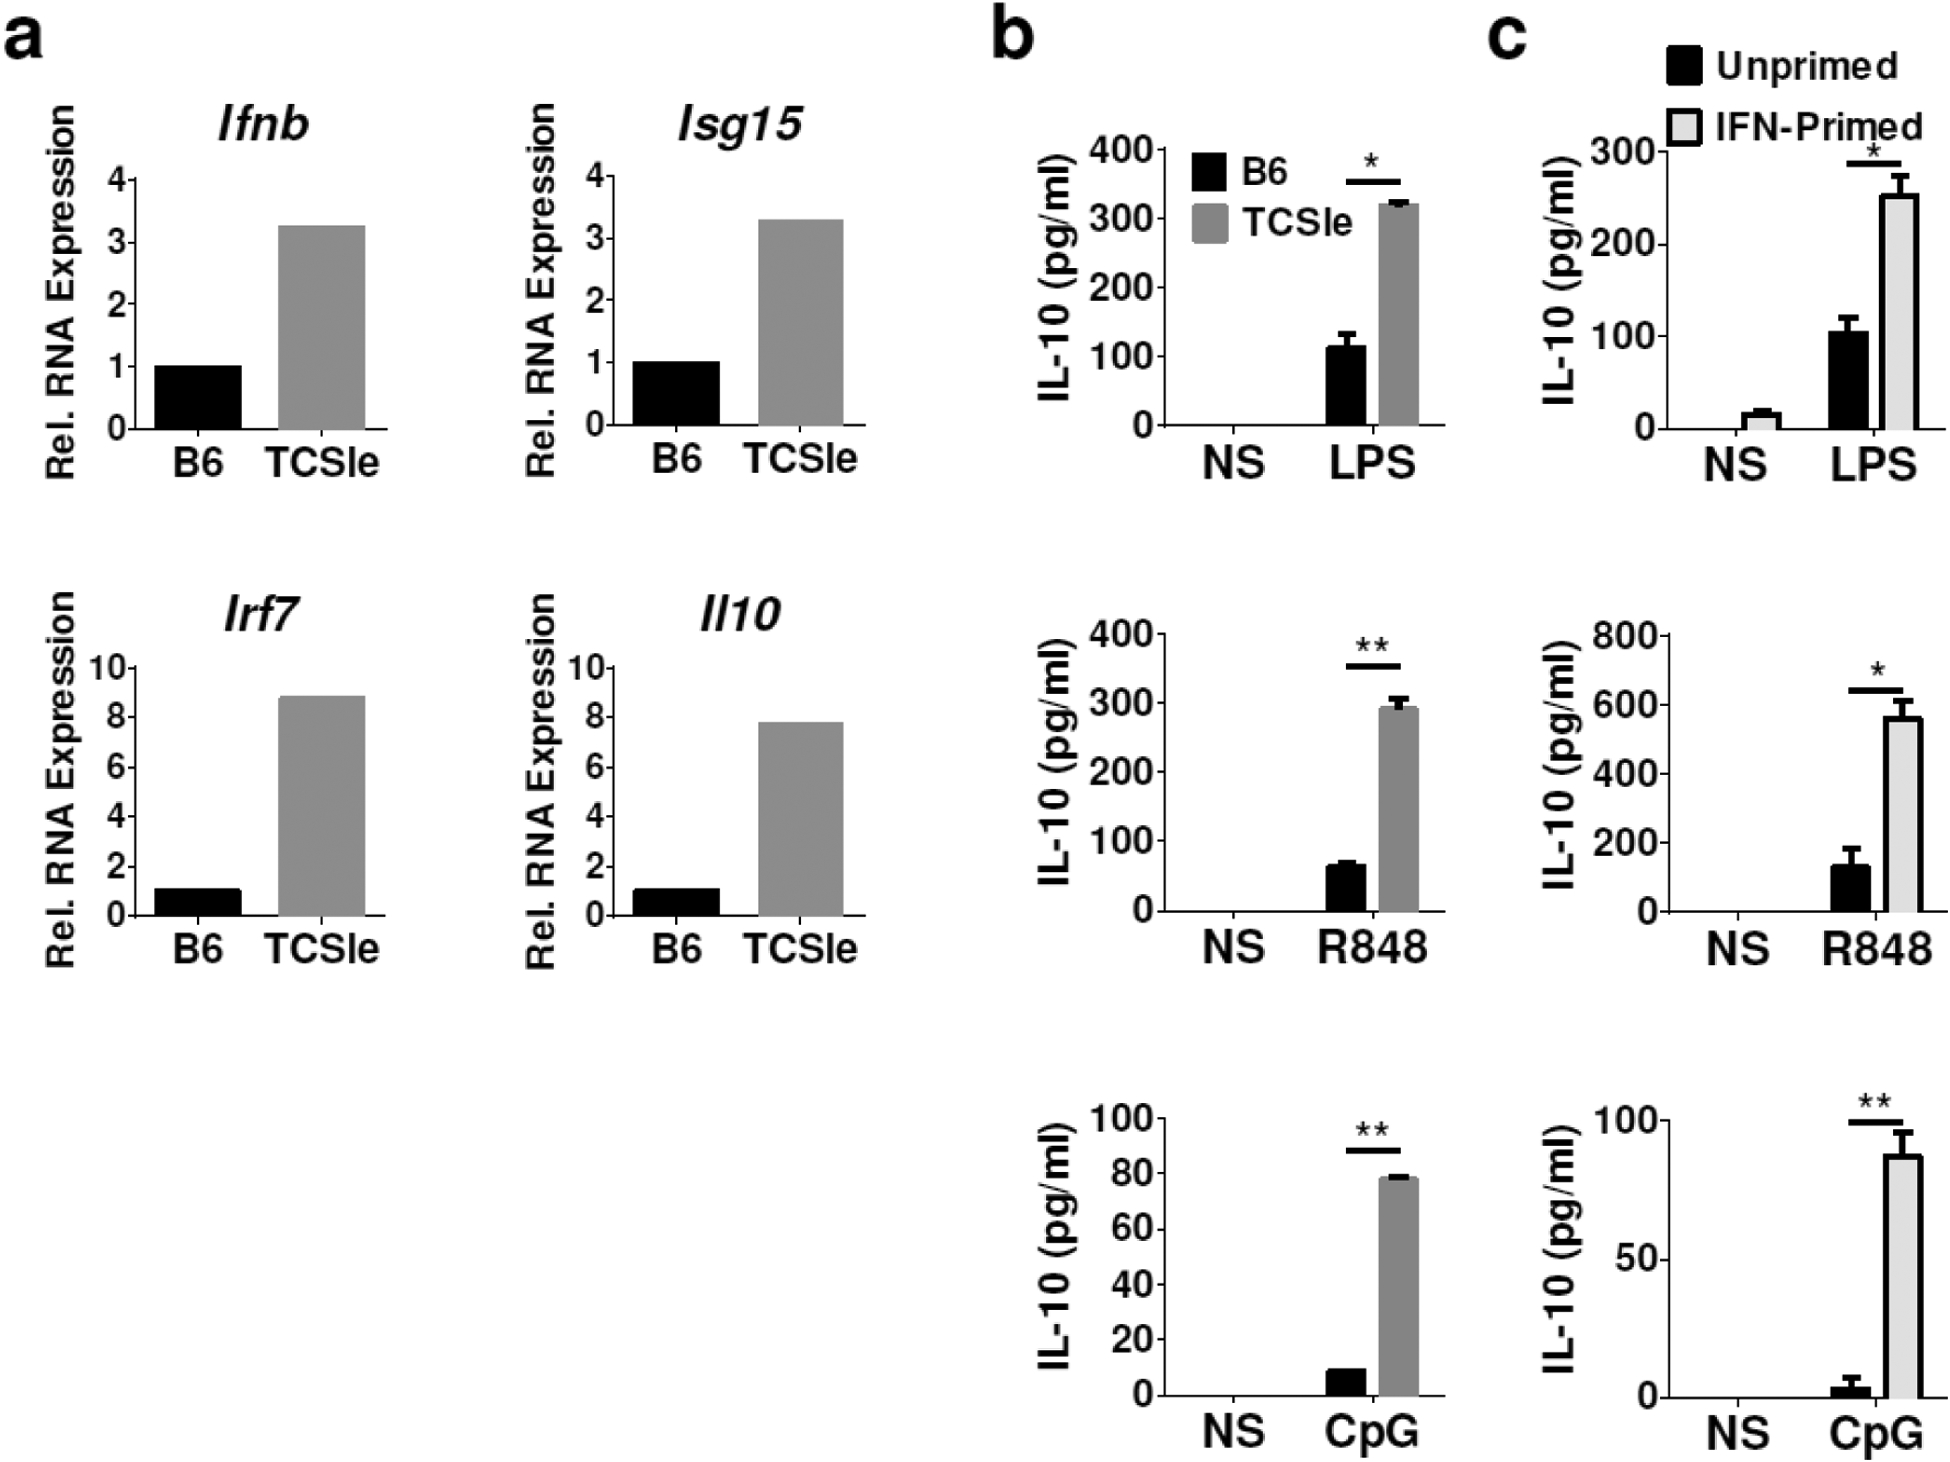
Figure 1.

The I-IFN signature and IL-10 in TCSle cDCs. (a) Basal gene expression was measured by qRT-PCR in TCSle cDCs and normalized to unstimulated B6 cDCs. (b) B6 and TCSle cDCs were stimulated with TLR4 ligand LPS (100 ng/ml), TLR7 ligand R848 (1 μg/ml) and TLR9 ligand CpG (10 μg/ml) for 24 hours. (c) B6 cDCs were stimulated with TLR ligands after 48 hours priming with 1500 U/ml of IFN-alpha. IL-10 was measured by ELISA. Figures are representative of at least 3 independent experiments, conducted with 3 cDCs cultures from 3 individual mice per strain.
