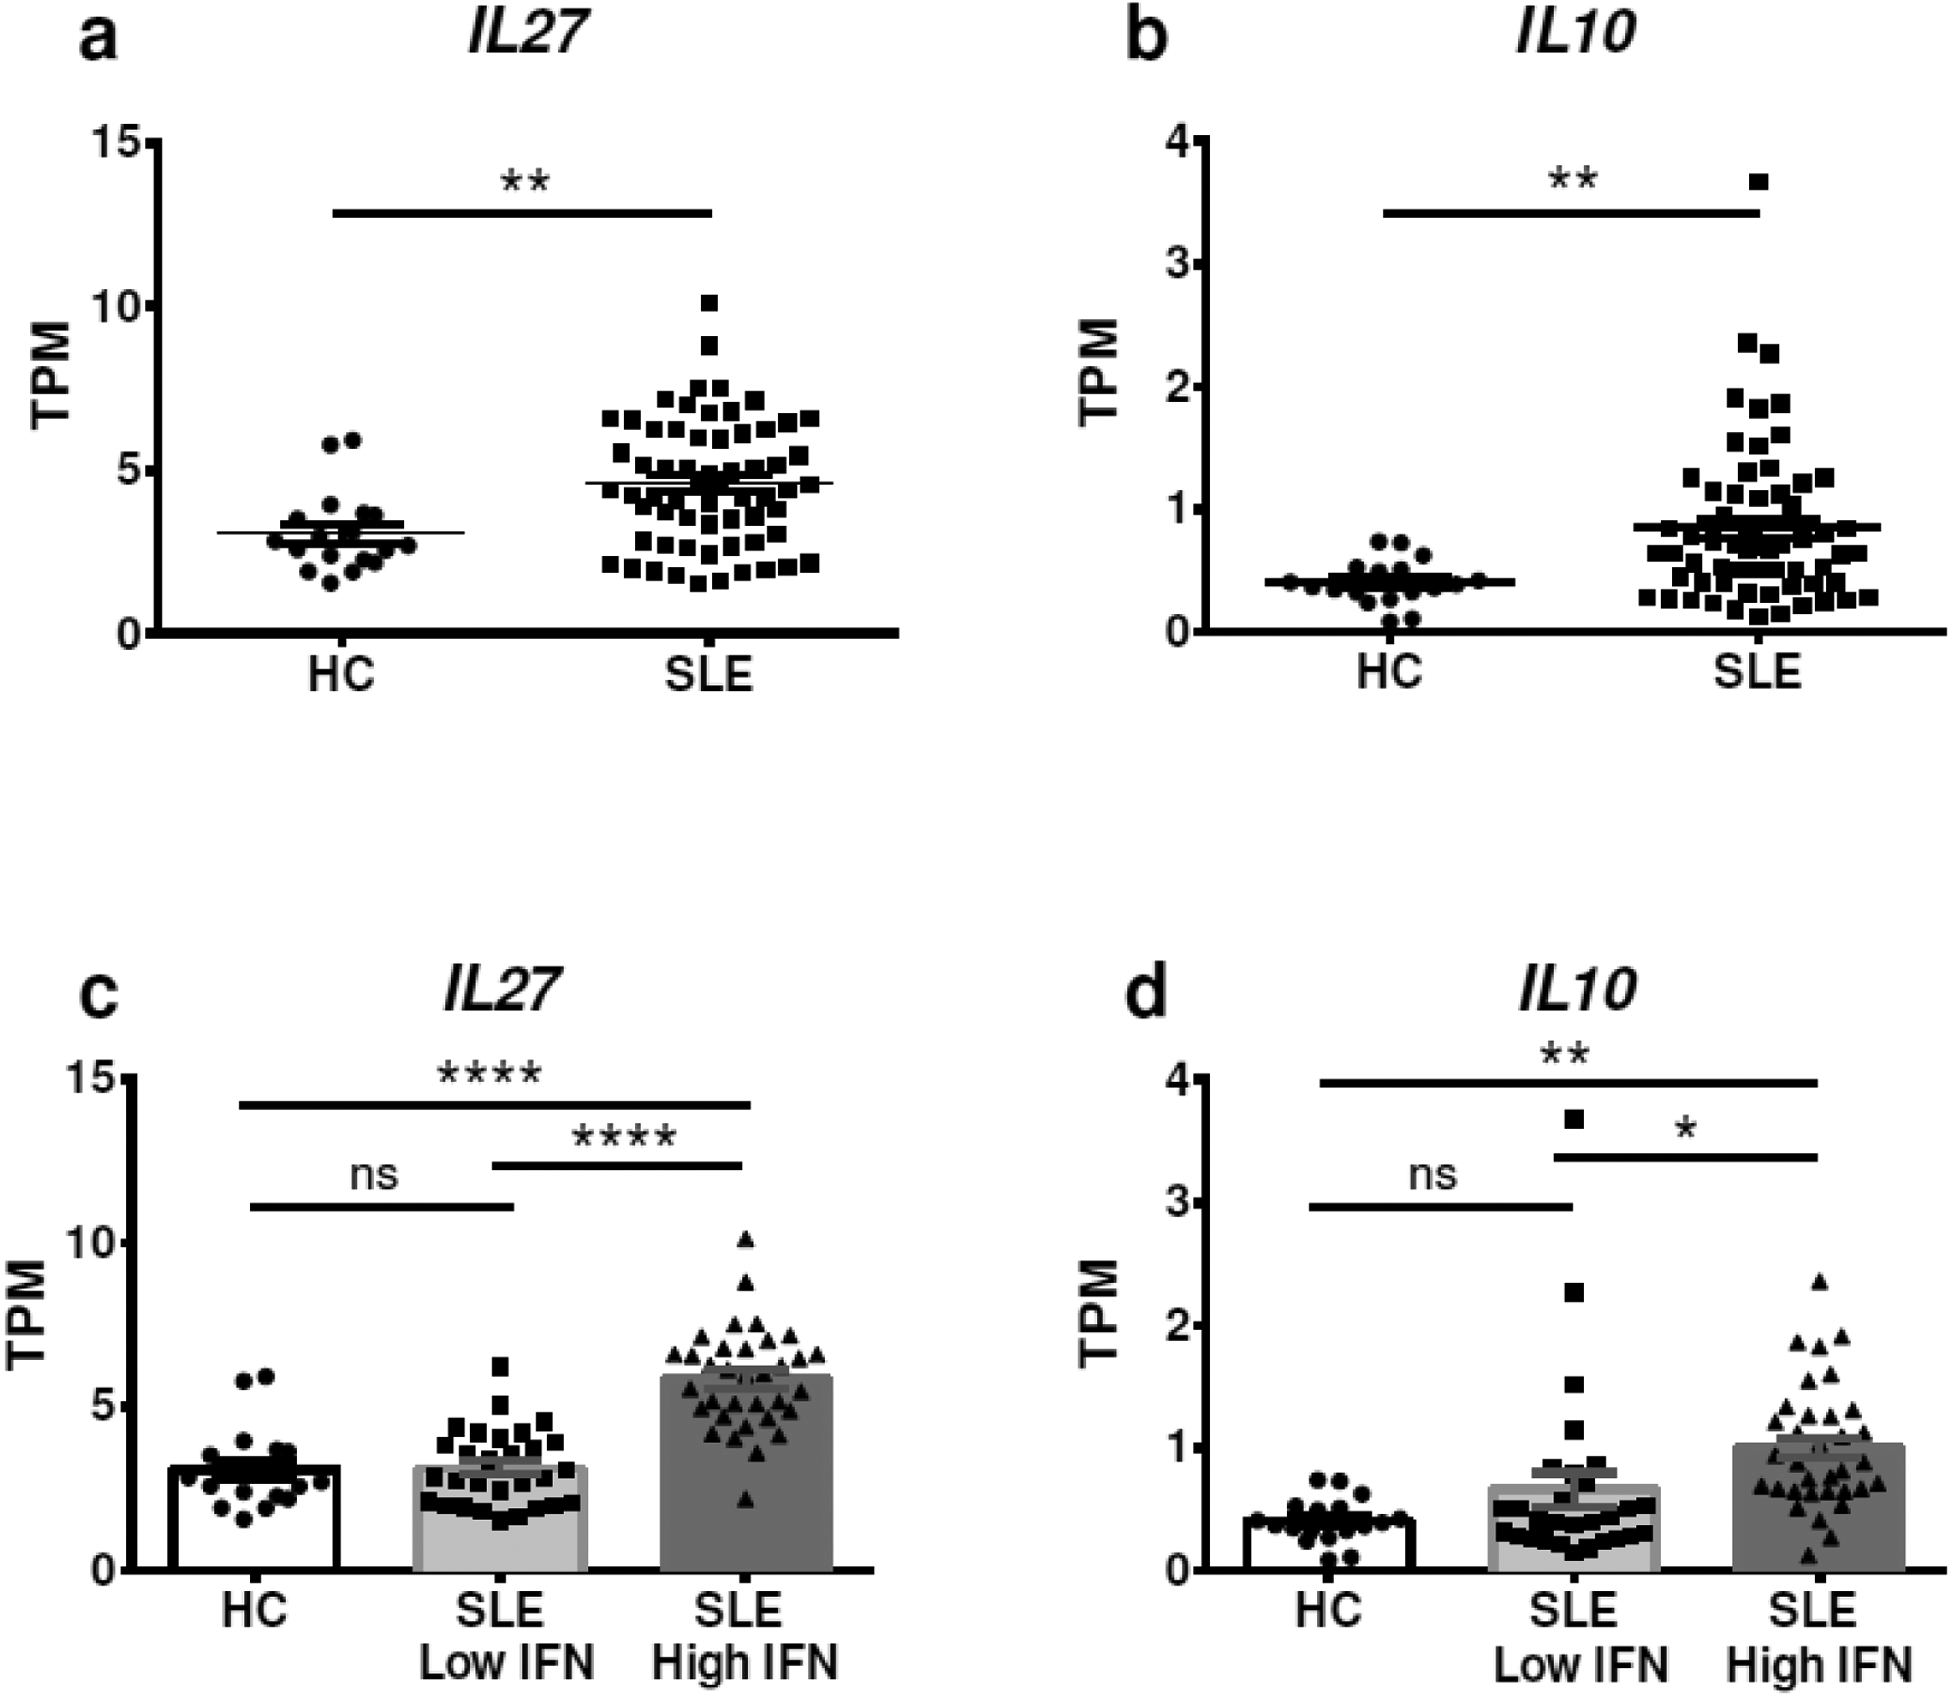
Figure 5.

Increased expression of IL10 and IL27 in a publicly available RNAseq data-set. RNAseq data from whole blood of 18 healthy controls and 99 SLE patients was obtained from NCBI Gene Expression Omnibus (GEO), accession number GSE72509. Data were analyzed using GraphPad Prism software, and (a) IL27 and (b) IL10 gene expression (presented as Transcripts Per Million [TPM]) was analyzed and compared between SLE patients and age- and sex-matched healthy controls. SLE patients were then divided in those expressing a low or high I-IFN signature, determined by analyzing the principal component analysis of 27 ISGs, and the expression of (c) IL27 and (d) IL10 gene expression was compared to age- and sex-matched healthy controls (HC). Statistical significance was calculated by Mann-Whitney test in (a) and (b), and by ANOVA with post-hoc Tukey’s multiple comparison test in (c) and (d). Individual samples, averages and SE are shown. *p < 0.05, **p < 0.01, ***p < 0.001, ****p < 0.0001, ns means not significant.
