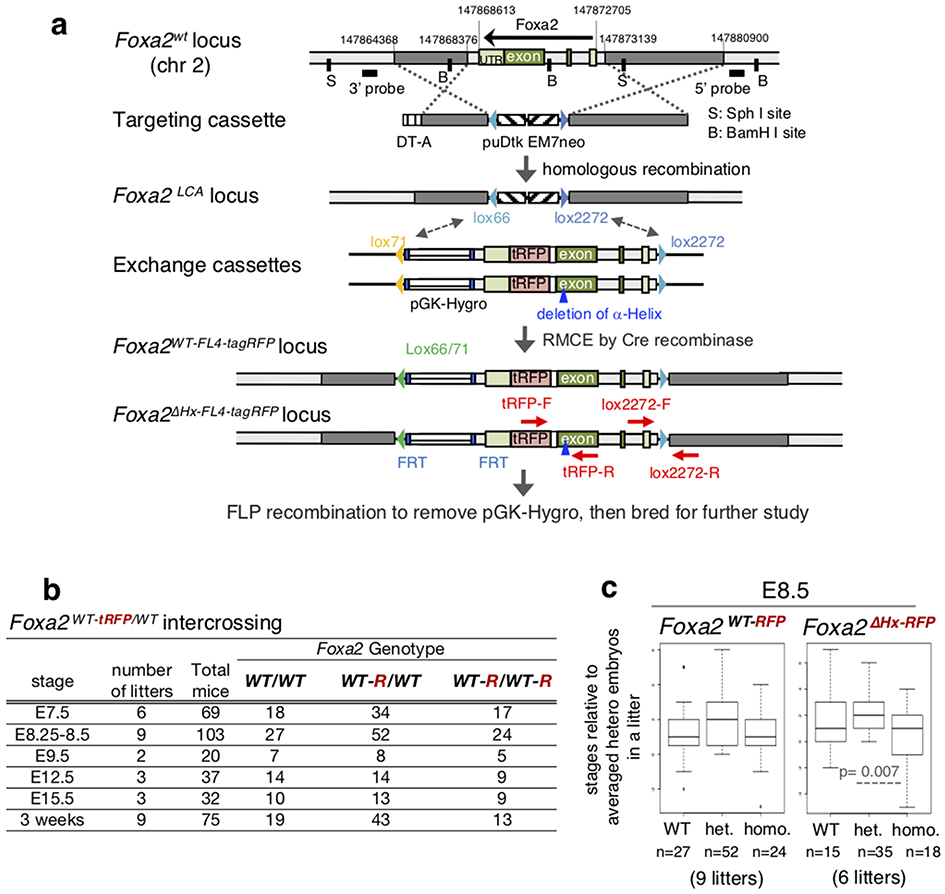
Extended Data Fig. 5. Gene targeting at the mouse Foxa2 locus.
a, Generation of Foxa2WT-tRFP and Foxa2ΔHx-tRFP knock-in alleles with targeting and exchange cassettes. b, Frequency of genotypes resulting from heterozygous intercrosses of Foxa2WT-tRFP/WT at embryonic stages. c, Box and whisker plots show stage distribution at wild-type, heterozygous, and homozygous of Foxa2WT-tRFP and Foxa2ΔHx-tRFP embryos at E8.5. The bottom and top of the boxes correspond to the 25th and 75th percentiles, and the internal band is the 50th percentile (median). The ends of the whiskers represent 1.5 times the IQR. The points represent outliers. The indicated P-values are obtained by one-sided Wilcoxon rank sum test.

