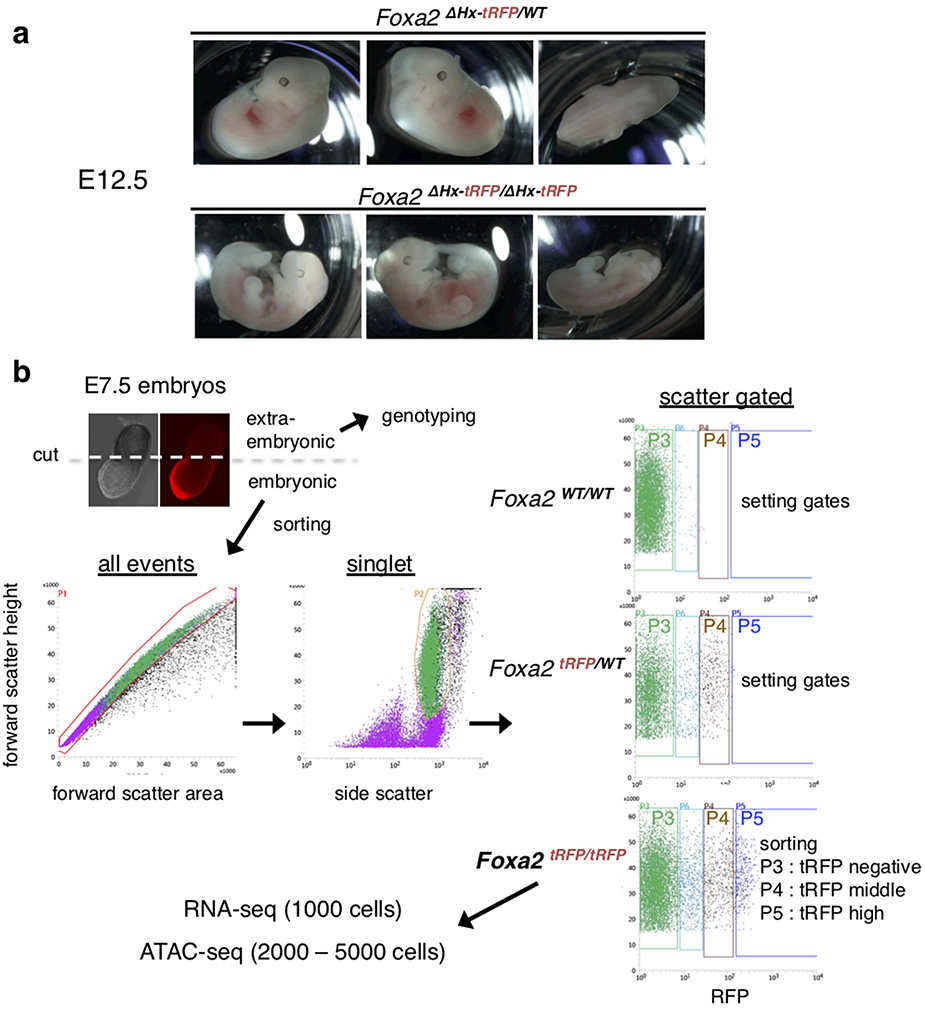
Extended Data Fig. 6. FACS gating to sort FOXA2-tRFP positive and negative cells in E7.5 embryos.
a, Bright field images of Foxa2ΔHx-tRFP/WT and Foxa2ΔHx-tRFP/ΔHx-tRFP (with a gross phenotype) littermate at E12.5 from heterozygous intercrosses. Images are representative of the numbers of embryos indicated in Figure 3a. b, Representative FACS pattern of FOXA-tRFP-high (P5 gate), -middle (P4 gate), and -negative (P3 gate) cells from Foxa2tRFP/tRFP E7.5 embryos. Foxa2WT/WT and Foxa2tRFP/WT samples were loaded only for setting the gates, but not for the sorting. The FOXA2-tRFP-middle (P4 gate) was set by avoiding autofluorescence and including up to the maximum tRFP intensity of heterozygous (Foxa2tRFP/WT) cells expressed. The FOXA2-tagRFP-high (P5 gate) exhibited a higher tagRFP signal than heterozygous cells. The FACS experiments were repeated more than 40 times independently with similar results.

