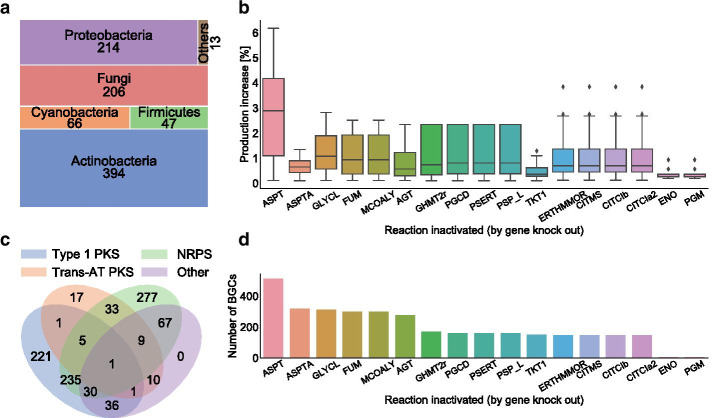
Fig. 3.
Automatic reconstruction and analysis of 943 BGCs from MIBiG. These BGCs cover a a range of different organisms and b a wide variety of hybrid BGCs. c Box plot showing the increase in production for the 17 different reaction knockouts that increase the production of one or more of the analysed BGCs. d Bar chart showing the number of BGCs where the knockout of each reaction is predicted to increase production of the target secondary metabolite. The names of the model reactions used in panel C and D: ASPT: aspartate ammonia-lyase; ASPTA: aspartate transaminase; GLYCL: glycine cleavage system; FUM: fumarase; MCOALY: malyl-CoA lyase; AGT: alanine-glyoxylate aminotransferase; GHMT2r: glycine hydroxymethyltransferase; PGCD: phosphoglycerate dehydrogenase; PSERT: phosphoserine transaminase; PSP_L: phosphoserine phosphatase; TKT1: transketolase; ERTHMMOR: 3-isopropylmalate dehydrogenase; CITMS: (R)-citramalate synthase; CITCIb: 2-methylmaleate hydratase; CITCIa2: (R)-2-Methylmalate hydro-lyase; ENO: enolase: PGM: phosphoglycerate mutase

