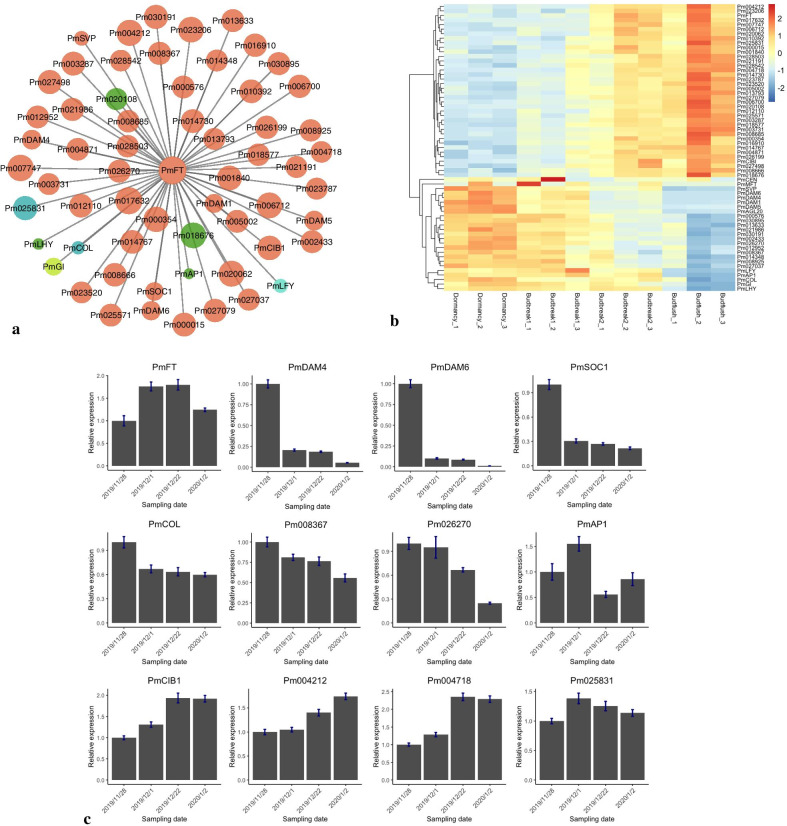
Fig. 9.
Co-expression network of FT during floral bud blooming in P. mume. a Cytoscape visualization of candidate genes co-expressed with PmFT during dormancy release. Candidate genes from the ‘brown’, ‘dark green, ‘green-yellow, ‘turquoise’, and ‘cyan’ modules are colored in brown, green, green-yellow, turquoise, and cyan, respectively. The circle size represents the significance of gene expression correlation with PmFT. b Expression patterns of PmFT and putative co-expressed genes during floral bud blooming. c Relative expression of PmFT and putative co-expressed genes verified by qRT-PCR analysis

