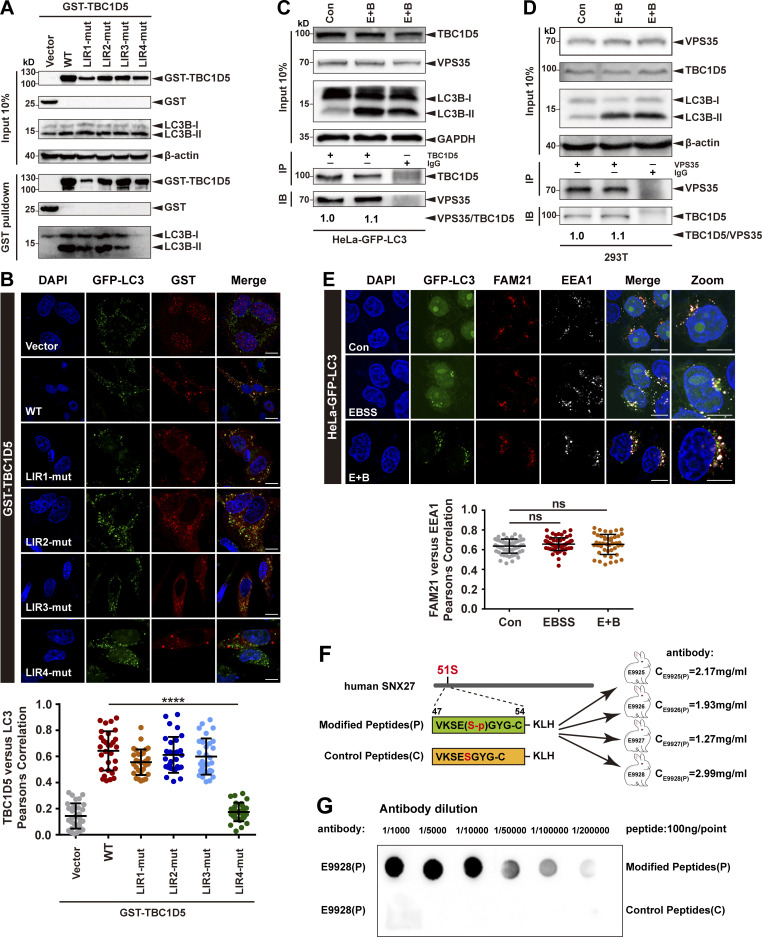
Figure S2.
The interaction between TBC1D5 and retromer is independent of LC3 and is not affected by starvation. (A) Pull-down assay to assess binding of GST-TBC1D5 and endogenous LC3B-II. HEK293T cells were transfected with GST-tagged TBC1D5 WT, LIR mutants, or empty vector (vector) for 24 h. Cells were starved for 4 h in EBSS in the presence of 100 nM BafA1 (E+B). One tenth of the cell lysate was prepared as input, and the rest was used for pull-down with glutathione (GSH) resin, followed by immunoblotting using antibodies against GST-TBC1D5 and LC3B. Representative images from one of three independent experiments are shown. (B) Confocal imaging for GST-TBC1D5 (red) and GFP-LC3 (green) immunofluorescence staining in HeLa cells stabling expressing GFP-LC3. TBC1D5 WT, each LIR mutant, or empty vector was transiently transfected in the cells for 24 h, followed by starvation for 4 h. Representative images from one of two independent experiments are shown. Scale bars: 10 µm. Pearson’s correlation coefficient for TBC1D5 and LC3 colocalization. Results for individual cells are plotted, along with the mean and SD for each group (n = 30); P values were calculated using one-way ANOVA by Tukey’s HSD test or t test. ****, P < 0.0001. (C) Immunoprecipitation of endogenous VPS35 from HeLa cells stably expressing GFP-LC3. The cells were either starved for 4 h (E+B) or not starved. One tenth of the cell lysate was prepared as input, and the rest was used for immunoprecipitation with anti-TBC1D5 antibody, followed by immunoblotting with antibody against VPS35. IgG served as a negative control. Representative images from one of two independent experiments are shown. The numbers under the bands represent the relative expression of VPS35 to TBC1D5. Band intensities were quantified with ImageJ and normalized to the control group. (D) Immunoprecipitation of endogenous TBC1D5 from HeLa cells stably expressing GFP-LC3. The cells were either starved for 4 h (E+B) or not starved. One tenth of the cell lysate was prepared as input, and the rest was used for immunoprecipitation with anti-VPS35 antibody, followed by immunoblotting with antibody against TBC1D5. IgG served as a negative control. Representative images from one of two independent experiments are shown. The numbers under the bands represent the relative expression of TBC1D5 to VPS35. Band intensities were quantified with ImageJ and normalized to control group. (E) Confocal microscopy imaging for FAM21 (red) and EEA1 (gray) immunofluorescence staining in HeLa cells stably expressing GFP-LC3 (green). The cells were starved for 4 h in EBSS in the presence or absence of 100 nM BafA1 (E+B). Representative images of two independent experiments are shown. Scale bars: 10 µm. Quantification of FAM21 immunofluorescence on EEA1-positive early endosomes. Results for individual cells are plotted, along with the mean and SD for each group (n = 59 cells for control, n = 66 for EBSS, and n = 44 for E+B); P values were calculated using one-way ANOVA by Tukey’s HSD test or t test. (F) The strategy to raise phospho-SNX27-Ser51-specific antibodies. Sequences of a phosphorylated peptide used for immunization, as well as the control peptide, are shown. (G) The phosphorylated peptide (P) or control nonphosphorylated peptide (C) was spotted on a nitrocellulose membrane, followed by immunoblotting with affinity-purified antibodies at different concentrations. Purified antibody E9928(P) was used in this study. HSD, honestly significant difference; ns, not significant.

