
Figure 6.
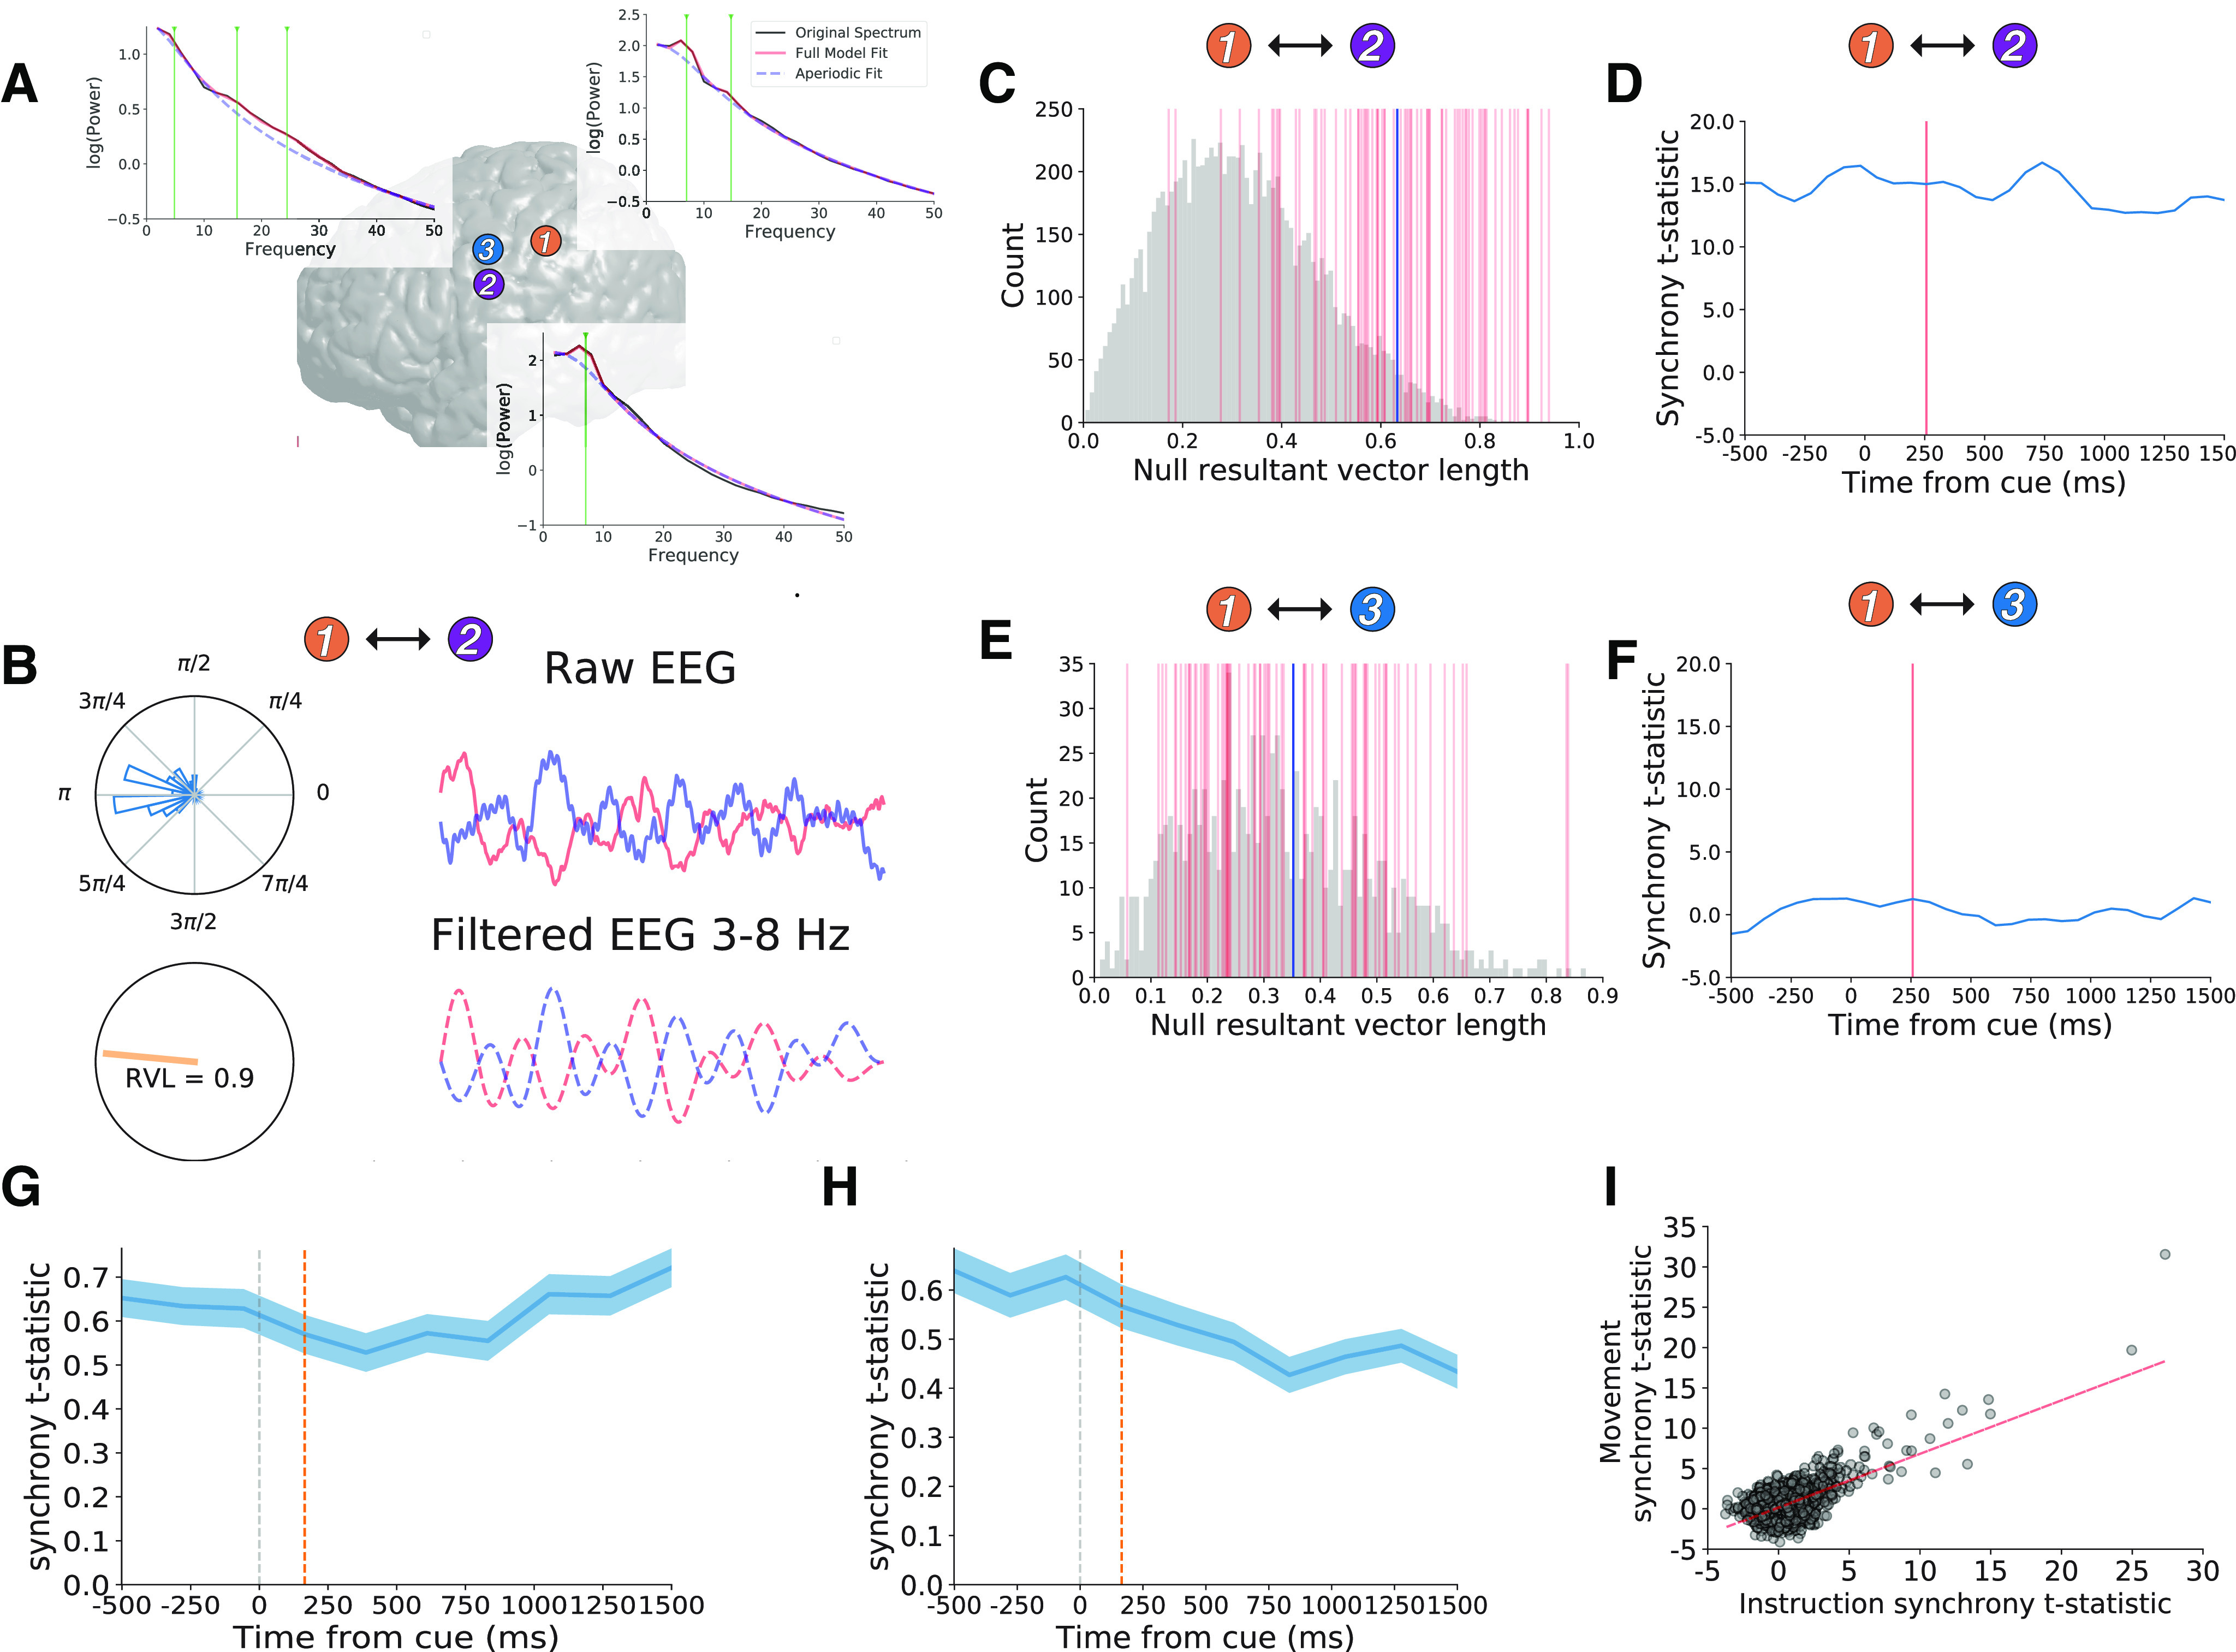
Theta oscillations are more synchronous than expected by chance. A, We illustrate our method for measuring theta phase synchrony using three example electrodes from the perirolandic cortex (color scheme matched to Fig. 2). Brain plot showing locations of each electrode and power spectra with green lines marking theta oscillation center frequencies (6.99 Hz in electrode 1, 7.07 Hz in electrode 2, and 4.84 Hz in electrode 3). B, Single trial data raw iEEG data (top, solid lines) and filtered 3- to 8-Hz iEEG (bottom, dashed lines) from electrode 1 (blue) and electrode 2 (red) during the instruction interval of interest (250 ms before and 750 ms after cue presentation). Polar plots show distribution of theta phase differences during this time interval showing a clustering around π. Orange line shows RVL (drawn on unit circle), which measures the non-uniformity or (tightness) of the phase distribution (RVL = 0.9 for this time interval). C, Null distribution of RVL values generated from random resampling of contiguous 1-s phase data from electrodes 1 and 2. Vertical red lines mark true RVL values from each trial. Blue vertical line marks the mean true RVL distribution. We quantified the extent to which phase synchrony across trials differed from the null distribution via unpaired t test resulting in a synchrony t statistic for the time interval. D, We show synchrony t statistics for the interaction between electrodes 1 and 2 surrounding several 1-s time intervals surrounding the instruction cue (−1000 ms before 2000 ms after using a sliding window analysis). Horizontal axis tick labels indicate the mean of each time window. Red line marks the mean of the instruction interval of interest (−250 to 750 ms). E, F, Same as C, D for interactions between electrode 1 and electrode 3. We observed significant synchrony between electrode 1 and electrode 2 (synchrony t statistic = 14.9, p < 0.001), but not between electrodes 1 and 3 during the instruction interval of interest (synchrony t statistic = 1.4, p > 0.15). G, H, Mean of synchrony t statistics over time across all electrode pairs (n = 1807) during the instruction (G) and movement intervals (H), with red lines marking the instruction and movement intervals of interest. We observed greater synchrony across electrode pairs than expected by chance (see main text for statistics). Width indicates SEM across electrode pairs. I, We observed positive correlation between instruction synchrony t statistics and movement-related synchrony t statistics across all electrode pairs.