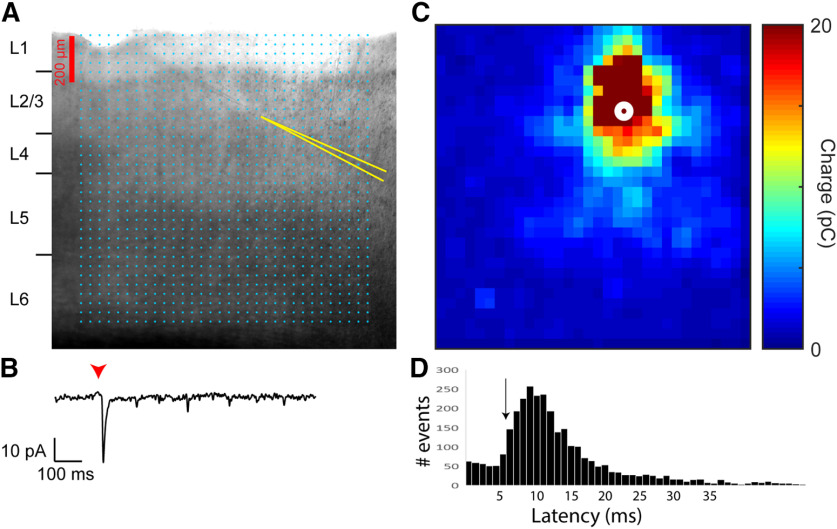
Figure 5.
Demonstration of LSPS mapping of input charge. A, Example image demonstrating positions of stimulation grid and recording electrodes in a coronal slice containing auditory cortex. Cyan points mark the sites of the 32 × 32 photostimulation grid. Recording pipette walls are highlighted in yellow lines. In the example, current recordings were simultaneously collected from two neurons. B, An example photostimulation-evoked current response from the cell positioned on the bottom right. Holding potential was −65 mV. Timing of the laser pulse (1 ms in duration) is indicated by the red arrowhead. A pronounced negative peak begins shortly after the laser onset. C, Map of input charge from current responses to photostimulation at all sites of the 32 × 32 stimulation grid. For recordings of excitatory responses, measured charge is inverted to positive values, and represented by color. D, Distribution of all IPSC latencies across all neurons in this study. The black arrow corresponds to the latency used to distinguish between direct and synaptic events in this study.

