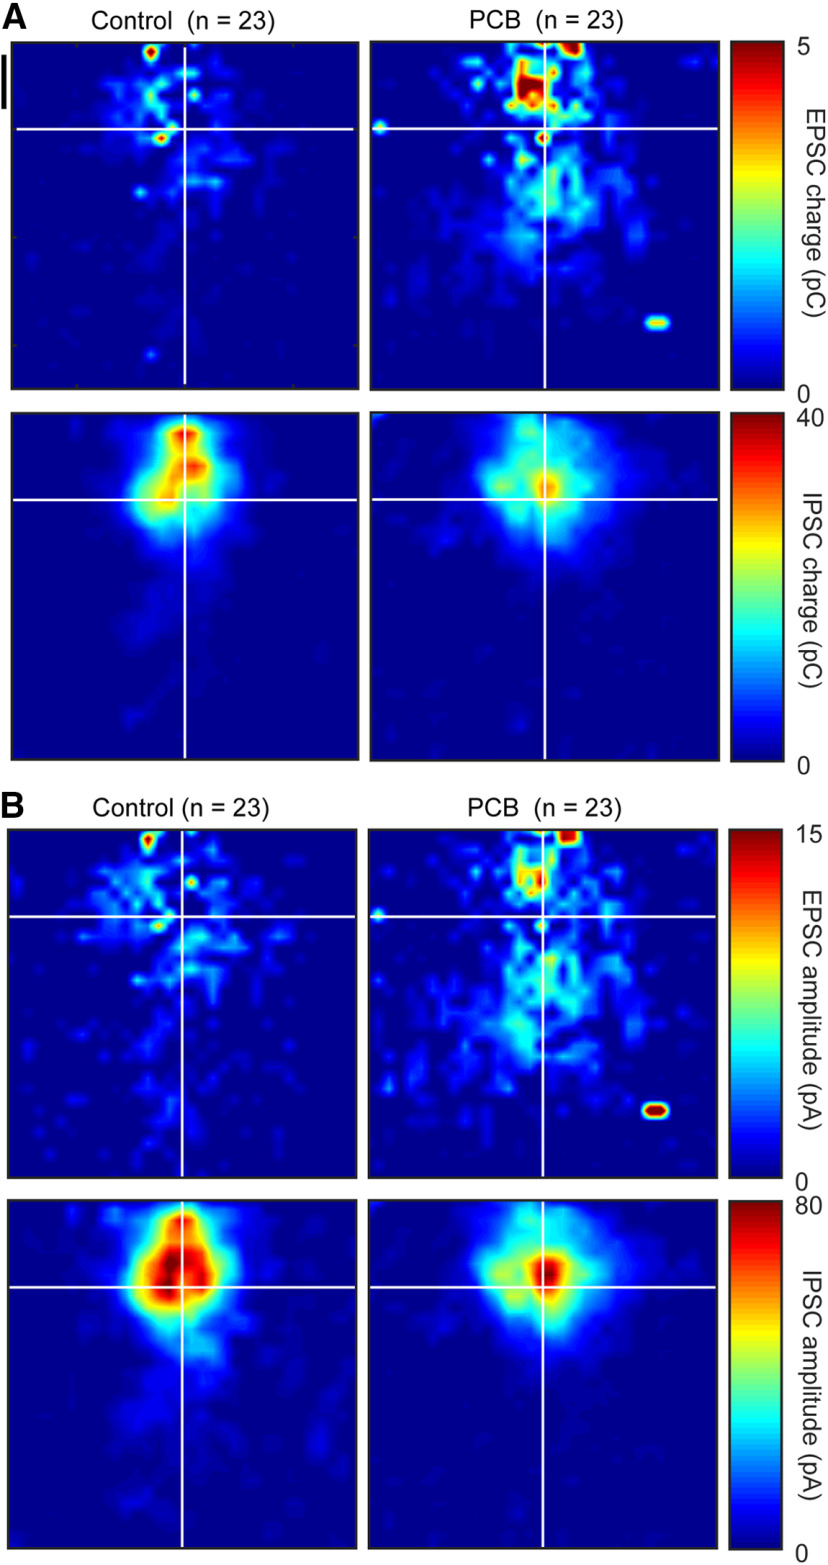
Figure 6.
Group averaged maps of photostimulation-evoked synaptic strength. Photostimulation-evoked input maps of charge (A) and amplitude (B) aligned to the recorded cell body. Measured charge at each site is averaged across all cells from each treatment group and is represented in color. EPSC charge maps are presented in the top plots, and IPSC charge maps are presented in the bottom plots. Black vertical scale bar marks 200 μm.

