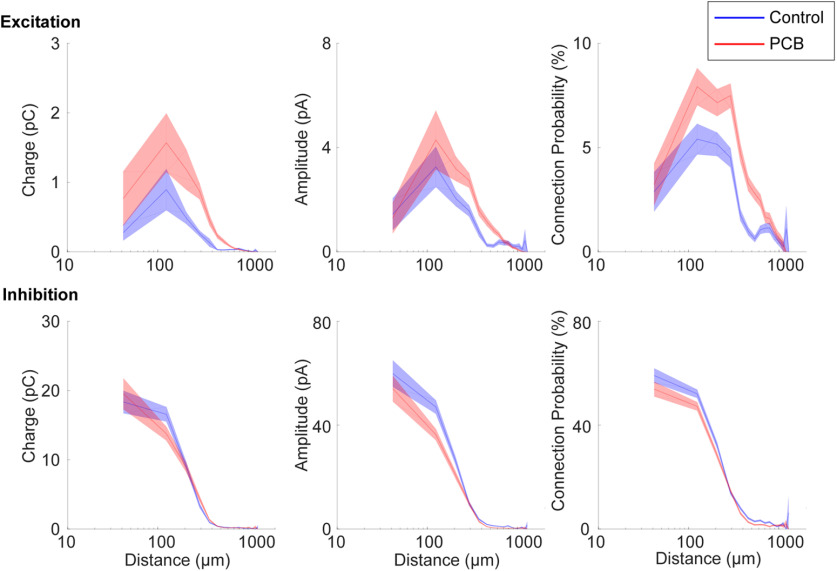
Figure 8.
Spatial profile of synaptic input. Distance profile of input charge and connection probability for control (blue) and PCB-exposed (red) treatment groups. Response measures are binned by input distance in 80-μm bins, and interpolation between bin means are marked by the solid lines. The shaded areas indicate 1 standard error bounds around the means.

