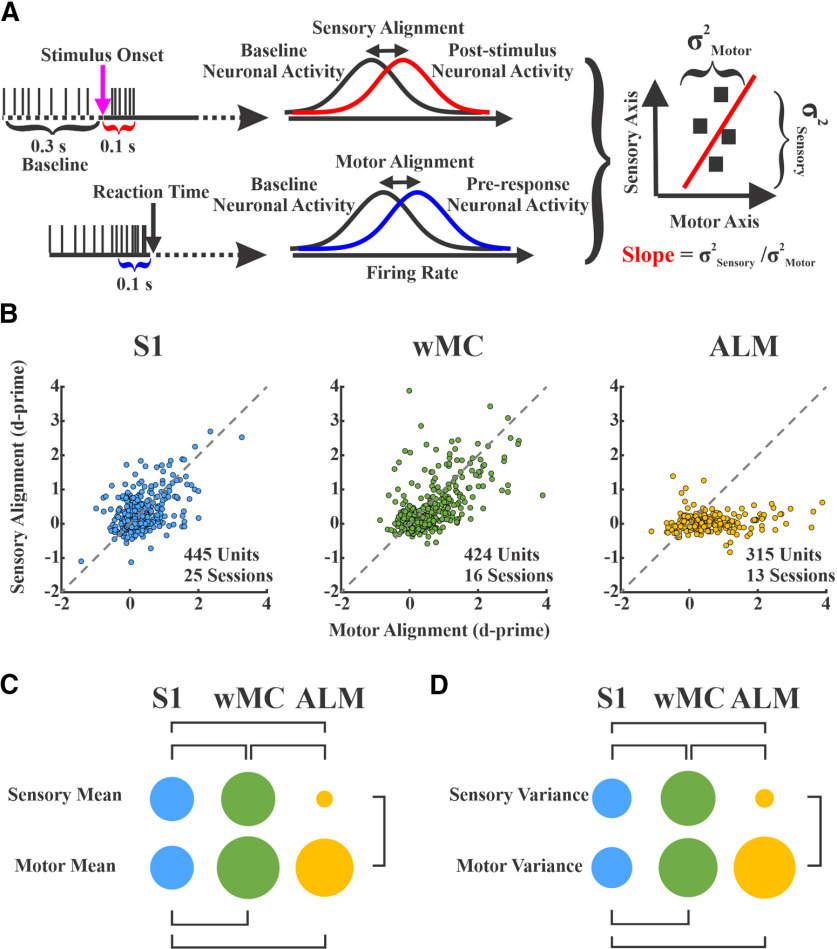
Figure 5.
Sensory and motor representations on hit trials across cortical regions. A, Schematic showing how the sensory and motor alignments were calculated; 100-ms windows, after stimulus onset (magenta arrow) and preceding RT (black arrow), were referenced as sensory (red) and motor (blue) epochs, respectively. Spike counts in these windows were compared with a prestimulus baseline (black). Right, Sensory-aligned versus motor-aligned values were plotted for each unit. Population measurements of each region included the sensory and motor alignment mean, variance (σ squared), and slope (sensory variance/motor variance). B, Sensory and motor alignment for all of the recorded units of S1 (left, n = 445), wMC (middle, n = 424), and ALM (right, n = 315). In each plot, the x-axis and the y-axis show motor and sensory alignment d-prime values, respectively. The dashed line indicates equal sensory and motor alignment. Note that S1 and wMC populations both show high variance along the unity line, whereas the ALM population shows high variance nearly exclusively along the motor-aligned axis. C, Each circle’s area is proportional to the mean value along the indicated axis. Statistically significant differences are indicated by bars (permutation statistics). Note the increase in both sensory and motor mean values from S1 to wMC and reduction in sensory mean value in ALM. D, Similar to C, with each circle’s area proportional to the variance of d-prime along the indicated axis.

