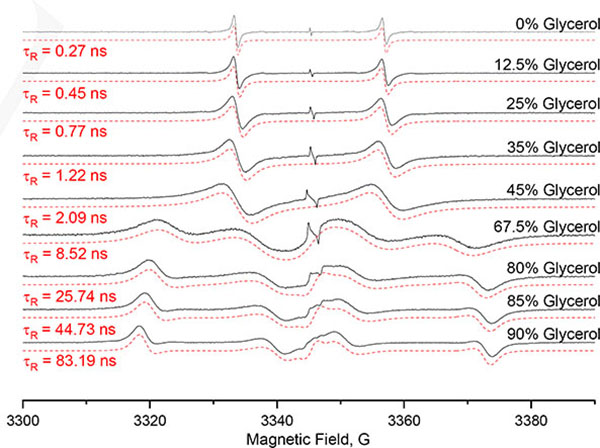
Figure 3.
X-Band EPR spectra (Black) of [13C1, 99%]-dFT (200 μM) in deoxygenated PBS with 0%, 12.5%, 25%, 35%, 45%, 67.5%, 80%, 85% and 90% (V/V) glycerol at 22°C. The spectra were simulated (red dashed lines) using the chili function of EasySpin, using gx=2.0031 gy=2.0031, gz=2.0027, and Ax=17 MHz, Ay=17 MHz, Az=162 MHz.

