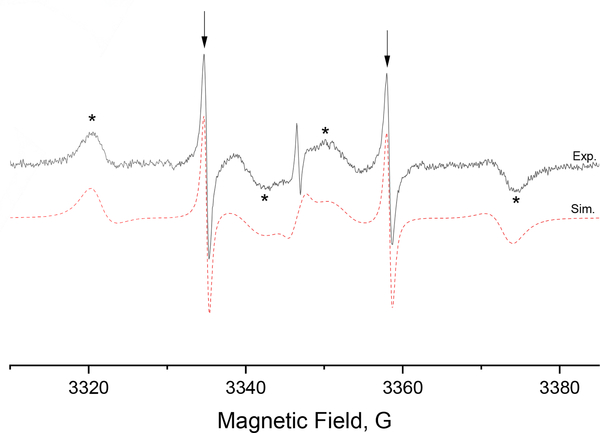
Figure 5.
X-Band EPR spectra (Black) of [13C1, 99%]-dFT (400 μM) with BSA (500 μM) in deoxygenated water at 22°C. The arrows show the free probe in fast tumbling while the asterisks show the probes bound to BSA with a slower tumbling rate. The red dashed line shows the simulated spectra for two spectral components with τR =36 ns and 0.28 ns.

