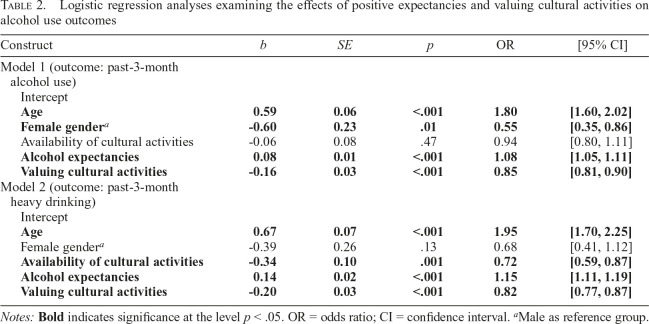
Table 2.
Logistic regression analyses examining the effects of positive expectancies and valuing cultural activities on alcohol use outcomes
| Construct | b | SE | p | OR | [95% CI] |
| Model 1 (outcome: past-3-month alcohol use) | |||||
| Intercept | |||||
| Age | 0.59 | 0.06 | <.001 | 1.80 | [1.60, 2.02] |
| Female gendera | -0.60 | 0.23 | .01 | 0.55 | [0.35, 0.86] |
| Availability of cultural activities | -0.06 | 0.08 | .47 | 0.94 | [0.80, 1.11] |
| Alcohol expectancies | 0.08 | 0.01 | <.001 | 1.08 | [1.05, 1.11] |
| Valuing cultural activities | -0.16 | 0.03 | <.001 | 0.85 | [0.81, 0.90] |
| Model 2 (outcome: past-3-month heavy drinking) | |||||
| Intercept | |||||
| Age | 0.67 | 0.07 | <.001 | 1.95 | [1.70, 2.25] |
| Female gendera | -0.39 | 0.26 | .13 | 0.68 | [0.41, 1.12] |
| Availability of cultural activities | -0.34 | 0.10 | .001 | 0.72 | [0.59, 0.87] |
| Alcohol expectancies | 0.14 | 0.02 | <.001 | 1.15 | [1.11, 1.19] |
| Valuing cultural activities | -0.20 | 0.03 | <.001 | 0.82 | [0.77, 0.87] |
Notes: Bold indicates significance at the level p < .05. OR = odds ratio; CI = confidence interval.
Male as reference group.

