
Figure 3.
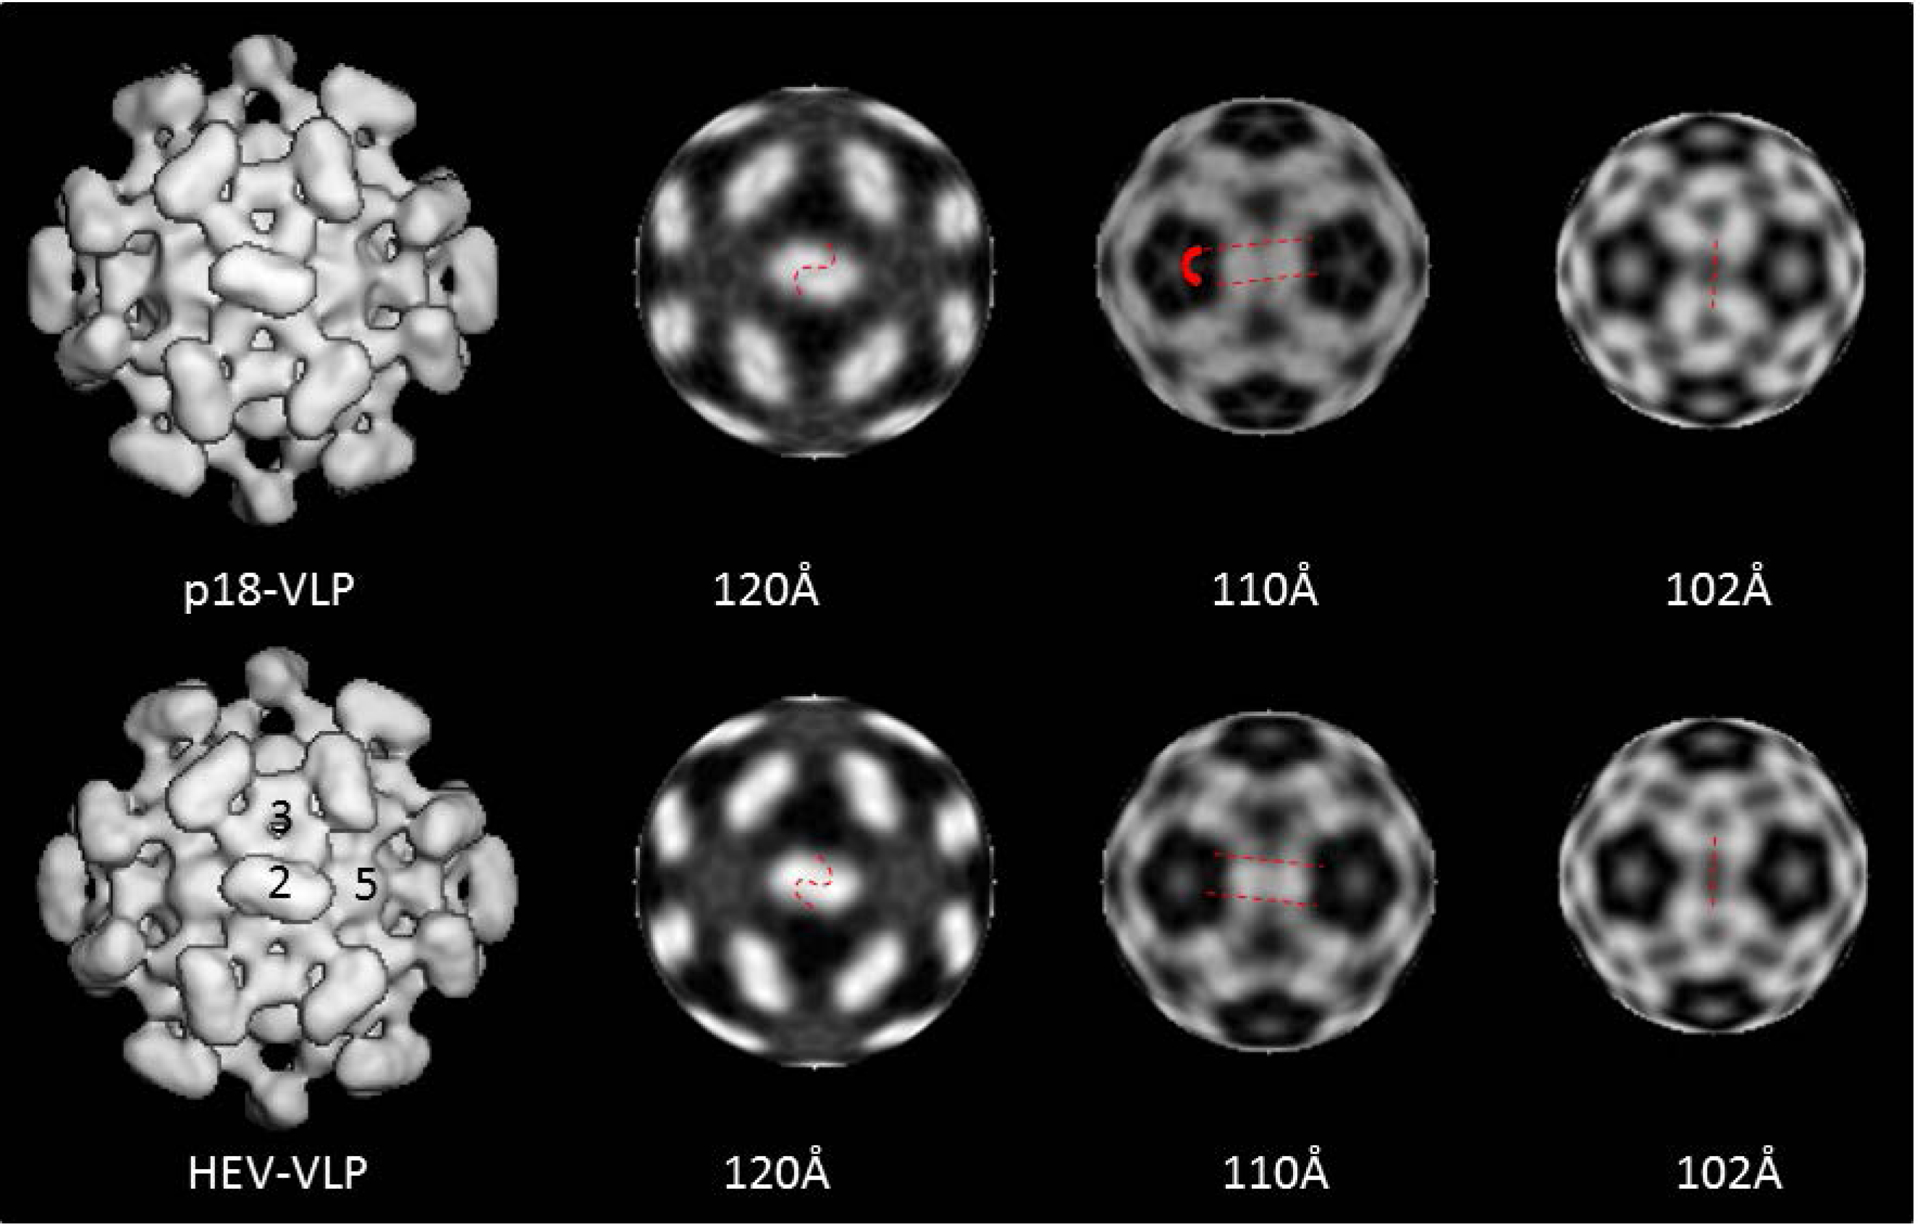
Three-dimensional density maps of p18-VLP (top panel) and the wild type HEV-VLPs (bottom panel). The surface rendering map shows that the p18-VLP resembles the appearance of HEV-VLP and contains spike and plateau at 2fold- and 3-fold axes, respectively (the position of icosahedral axes is labeled with the corresponding number). The particles were sliced into thin sections to show the density distribution at radii of 120 Å (the P-domain), 110 Å (the M-domain) and the 102 Å (the S-domain). The red dashed lines profile the difference between the p18-VLP and the wild type HEV-VLP.