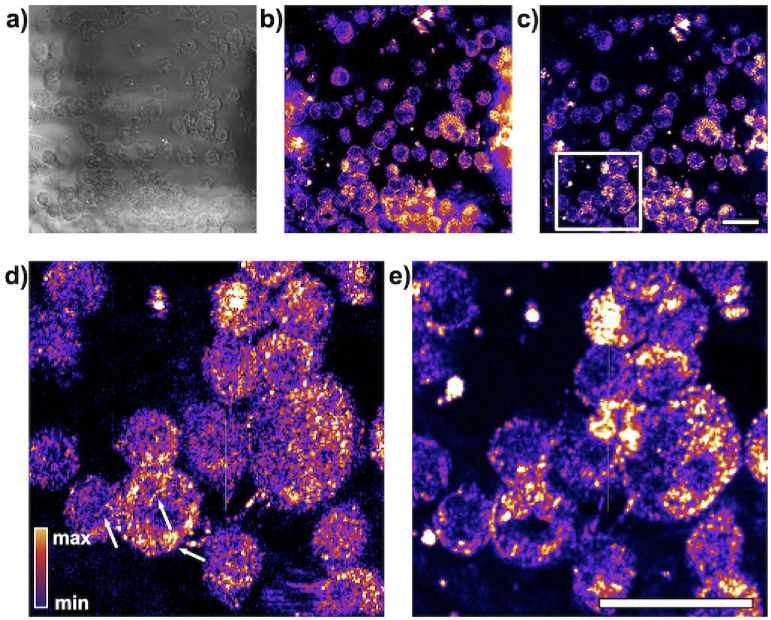
Fig. 6.
Dynamic imaging of live macrophage cells reveal metabolic activity at the subcellular level. a) Average of intensity of OCM reconstructions. b) Average temporal frequency content (average of pixel-wise FFT with DC component excluded). c) Variance of the frequency content. Frequency analysis produces higher contrast between the cell nuclei and cytoplasm if longer image sequences are analyzed - 500 s in e). However, for shorter sequences captured at a 500 Hz rate over 1 s as shown in d), individual organelles become more pronounced (white arrows). d) and e) are cropped image subregions as indicated by the white box in c). Scale bar represents 20 .

