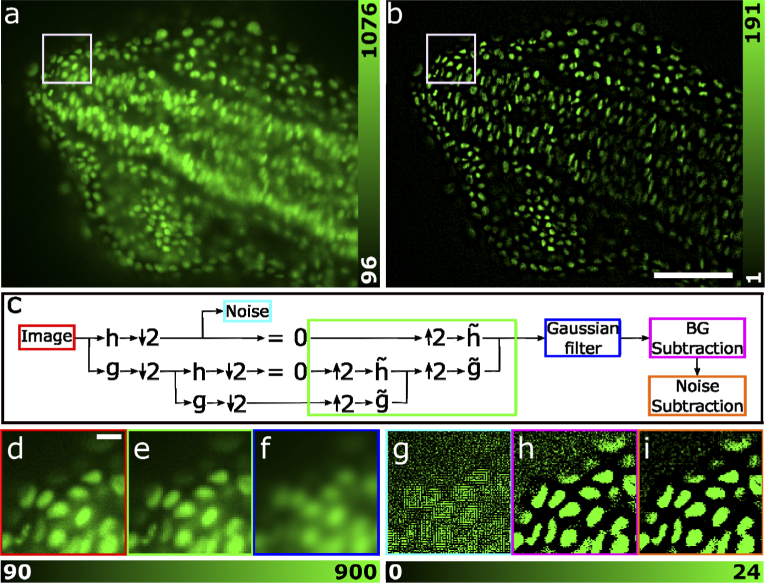
Fig. 1.
The WBNS software and its application to fluorescence images. (a) DSLM image from a 3D image stack showing cell nuclei of a zebrafish embryo (head section) labelled with GFP. Data are taken from Ref. [6]. (b) The corresponding image after processing with WBNS. Scale bar, 100 µm. (c) Flowchart of the WBNS algorithm. First, the input image (red box) is decomposed by consecutively applying two wavelets acting as high-pass (h) and low-pass (g) filters, followed by subsampling by a factor of two (↓2). The details of the first level contain high-frequency noise (cyan box) on characteristic length scales smaller than the PSF. This decomposition is repeated multiple times, here we show only two levels for brevity. Higher level approximations contain the low-frequency background. We set the details to zero and reconstruct an image by upsampling (↑2) and applying the inverse wavelet transform () at all levels to obtain the background estimate (green box). A Gaussian filter (blue box) smooths discontinuities. Finally, the background (magenta) and the noise (orange) are subtracted from the image. (d)-(i) Close-ups of the image (white boxes in panels a and b) during different stages of the algorithm. The colors of the image frames agree with those of the corresponding boxes in panel (c). (d) Original image (scale bar, 8 µm), (e) unfiltered and (f) Gaussian filtered background estimate, (g) extracted noise image, (h) image after background subtraction and (i) image after background and noise subtraction. Panels (g), (h) and (i) are shown with enhanced contrast to visualize the effects on the noise. The pixel intensities are encoded as indicated by the color bars below the images.

