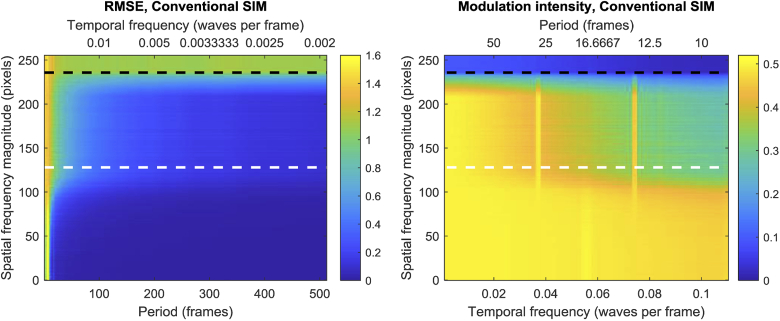
Fig. 4.
Left: RMSE between the average intensity of different Fourier spatial frequencies (y axis) of the reconstructed image and the temporal intensity modulation of the raw SIM frames for different modulation periods (x axis). The intensity of different spatial frequency components is averaged along a certain radius in the Fourier domain (y -axis). The bigger the radius, the higher the spatial frequency. The white and black horizontal dashed lines highlight the theoretical diffraction limit and the limit of the SIM OTF respectively. Right: Normalized temporal frequency magnitude at the temporal oscillation frequency, as a function of temporal frequency and spatial frequency magnitude. Note that the X axis is in monotonically-increasing units of temporal frequency, because the temporal periods are constrained to an even integer divisor of 512 (the number of simulated timepoints).

