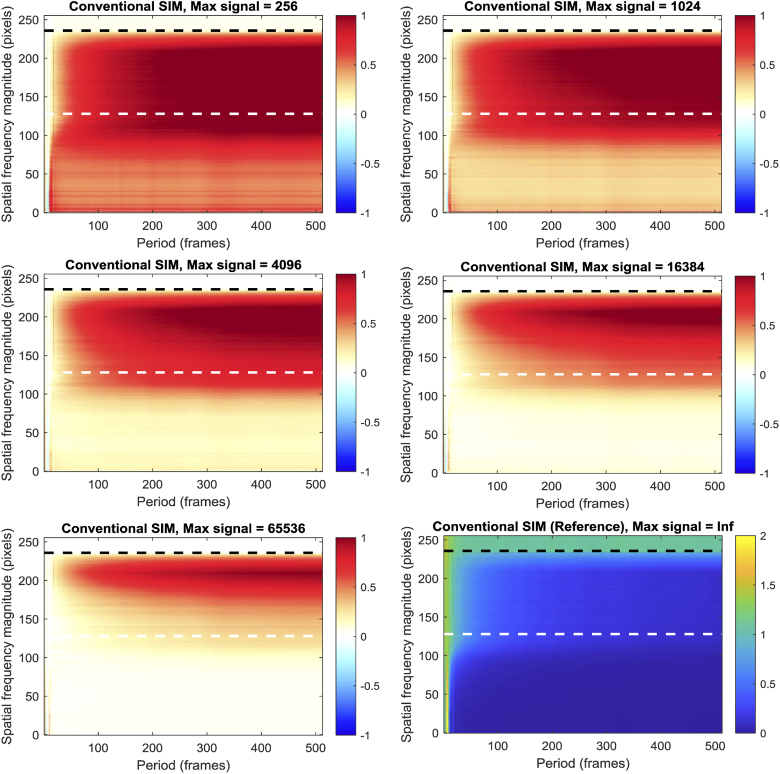
Fig. 5.
Noise sensitivity of SIM reconstruction, as a function of spatial frequency magnitude and temporal oscillation period. All data presented as RMSE relative to the noise-free reference image, bottom right. Note the different scale on the color bars for the reference data relative to the noise data. The white and black horizontal dashed lines highlight the theoretical diffraction limit and the limit of the SIM OTF respectively.

