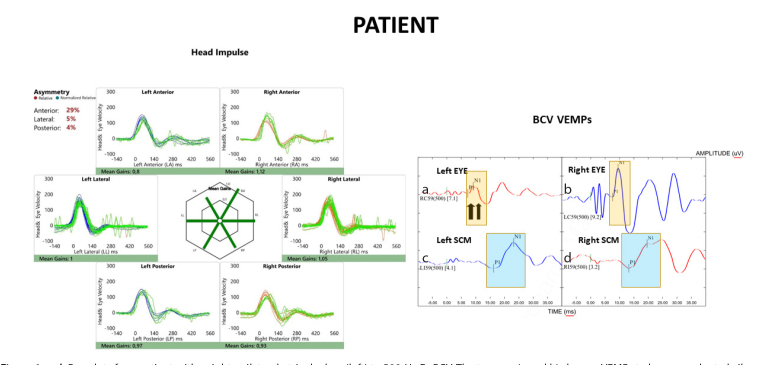
Figure 1. a–d.
Raw data for a patient with a right unilateral utricular loss (left) to 500-Hz Fz BCV. The top row (a and b) shows oVEMPs to bone-conducted vibration: the yellow rectangle shows the time of the n10 response, which is markedly reduced beneath the left eye of the patient (left column), indicating utricular macula hypofunction in the right ear. The patient’s left eye, corresponding to the right ear, shows a normal oVEMP response. The down row (c and d) shows the cVEMPs to 500-Hz Fz BCV: the blue rectangle shows the time of the p13 (p1) and n23 (n1) responses, marked with small vertical lines. These responses are normal in both the patient and the healthy subject (see Figure 2). The left side (for the viewer) of the figure shows results of vHIT testing of both left and right semicircular canals: eye velocity (green traces) and head velocity (blue traces for the left side and red traces for the right side) versus time. The signs of head velocity for rightward impulses and of eye velocity for leftward impulses have been inverted for easier comparison. Both the patient and the healthy subject (see Figure 2) show normal responses for head impulses to both sides—eye velocity matched head velocity closely.

