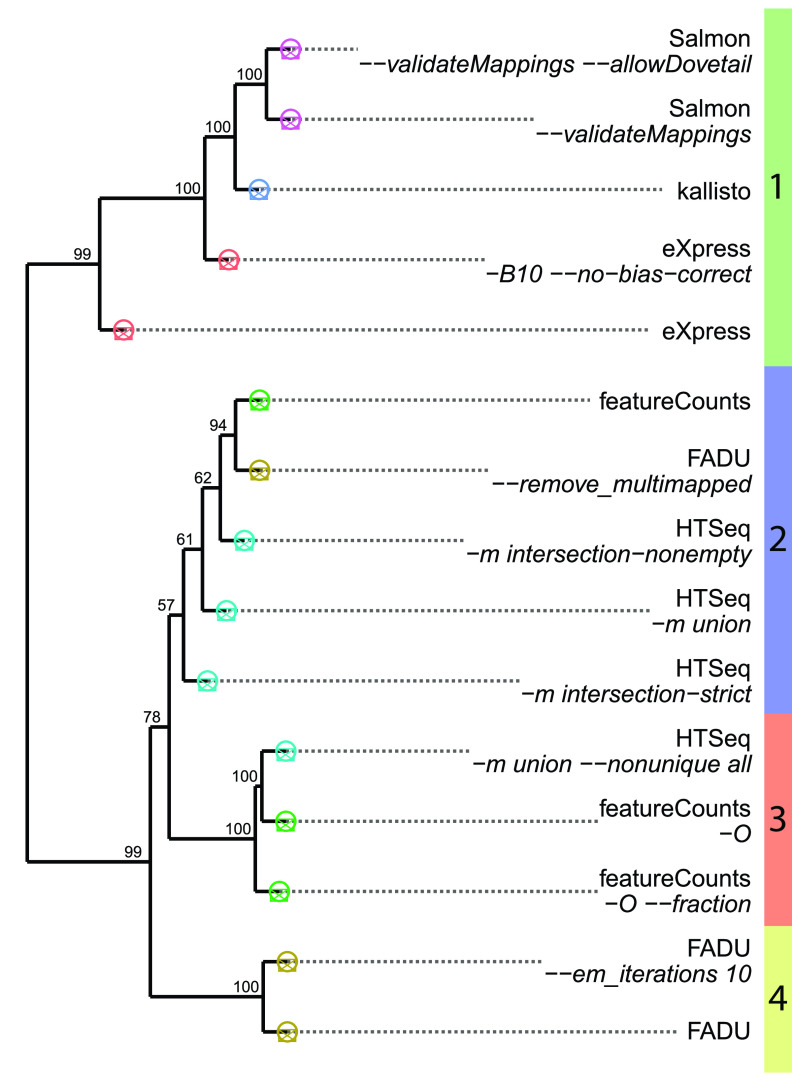
FIG 2.
Performance of FADU in a simulated differential expression analysis. A 100-bootstrap dendrogram was generated using the counts obtained from 9 different RNA-Seq quantification methods on a simulated E. coli data set. The points at the edges of the dendrogram are colored to represent the different tools corresponding to each method. The colored bar at the edge of the dendrogram represents the different clusters of quantification tools.

